Immigrants from Liberia vs Marshallese Median Earnings
COMPARE
Immigrants from Liberia
Marshallese
Median Earnings
Median Earnings Comparison
Immigrants from Liberia
Marshallese
$42,923
MEDIAN EARNINGS
0.7/ 100
METRIC RATING
264th/ 347
METRIC RANK
$41,969
MEDIAN EARNINGS
0.2/ 100
METRIC RATING
281st/ 347
METRIC RANK
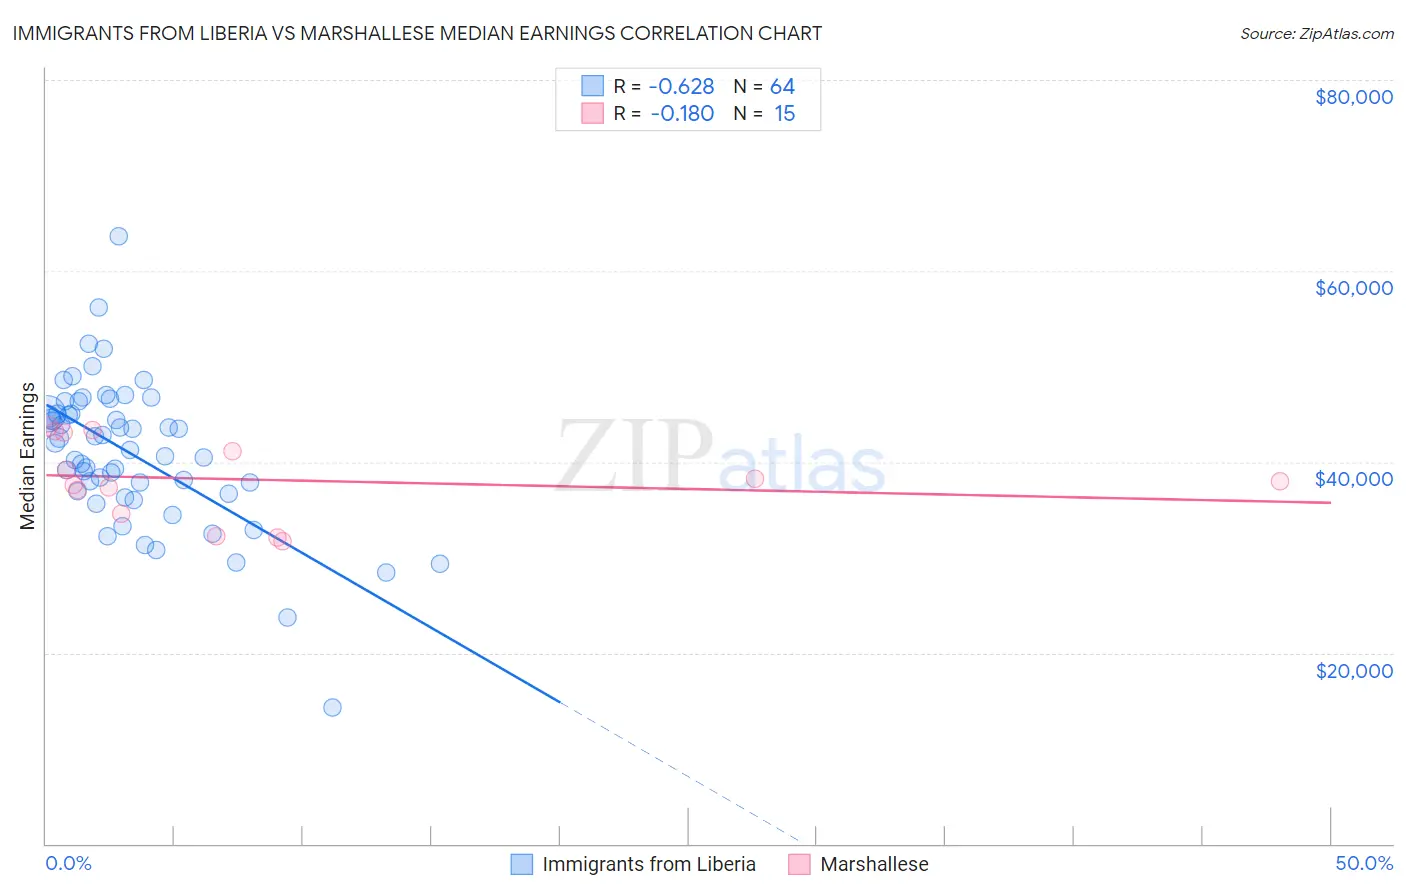
Immigrants from Liberia vs Marshallese Median Earnings Correlation Chart
The statistical analysis conducted on geographies consisting of 135,295,960 people shows a significant negative correlation between the proportion of Immigrants from Liberia and median earnings in the United States with a correlation coefficient (R) of -0.628 and weighted average of $42,923. Similarly, the statistical analysis conducted on geographies consisting of 14,760,991 people shows a poor negative correlation between the proportion of Marshallese and median earnings in the United States with a correlation coefficient (R) of -0.180 and weighted average of $41,969, a difference of 2.3%.
Median Earnings Correlation Summary
| Measurement | Immigrants from Liberia | Marshallese |
| Minimum | $14,336 | $31,625 |
| Maximum | $63,608 | $43,685 |
| Range | $49,272 | $12,060 |
| Mean | $40,857 | $38,147 |
| Median | $41,575 | $37,917 |
| Interquartile 25% (IQ1) | $36,787 | $34,587 |
| Interquartile 75% (IQ3) | $45,056 | $43,141 |
| Interquartile Range (IQR) | $8,269 | $8,554 |
| Standard Deviation (Sample) | $7,722 | $4,207 |
| Standard Deviation (Population) | $7,661 | $4,065 |
Demographics Similar to Immigrants from Liberia and Marshallese by Median Earnings
In terms of median earnings, the demographic groups most similar to Immigrants from Liberia are Salvadoran ($42,912, a difference of 0.030%), Immigrants from Laos ($42,884, a difference of 0.090%), Inupiat ($43,000, a difference of 0.18%), Nicaraguan ($43,026, a difference of 0.24%), and Cree ($42,777, a difference of 0.34%). Similarly, the demographic groups most similar to Marshallese are African ($41,955, a difference of 0.030%), Hmong ($42,111, a difference of 0.34%), Colville ($42,151, a difference of 0.43%), Cajun ($42,189, a difference of 0.53%), and Central American ($42,280, a difference of 0.74%).
| Demographics | Rating | Rank | Median Earnings |
| Nicaraguans | 0.8 /100 | #262 | Tragic $43,026 |
| Inupiat | 0.8 /100 | #263 | Tragic $43,000 |
| Immigrants | Liberia | 0.7 /100 | #264 | Tragic $42,923 |
| Salvadorans | 0.7 /100 | #265 | Tragic $42,912 |
| Immigrants | Laos | 0.7 /100 | #266 | Tragic $42,884 |
| Cree | 0.6 /100 | #267 | Tragic $42,777 |
| Americans | 0.6 /100 | #268 | Tragic $42,742 |
| Belizeans | 0.5 /100 | #269 | Tragic $42,702 |
| Osage | 0.5 /100 | #270 | Tragic $42,651 |
| Pennsylvania Germans | 0.5 /100 | #271 | Tragic $42,615 |
| Iroquois | 0.4 /100 | #272 | Tragic $42,430 |
| Immigrants | Dominica | 0.4 /100 | #273 | Tragic $42,420 |
| Immigrants | El Salvador | 0.4 /100 | #274 | Tragic $42,413 |
| Immigrants | Belize | 0.3 /100 | #275 | Tragic $42,339 |
| Spanish Americans | 0.3 /100 | #276 | Tragic $42,316 |
| Central Americans | 0.3 /100 | #277 | Tragic $42,280 |
| Cajuns | 0.3 /100 | #278 | Tragic $42,189 |
| Colville | 0.2 /100 | #279 | Tragic $42,151 |
| Hmong | 0.2 /100 | #280 | Tragic $42,111 |
| Marshallese | 0.2 /100 | #281 | Tragic $41,969 |
| Africans | 0.2 /100 | #282 | Tragic $41,955 |