Immigrants from Liberia vs Austrian Median Earnings
COMPARE
Immigrants from Liberia
Austrian
Median Earnings
Median Earnings Comparison
Immigrants from Liberia
Austrians
$42,923
MEDIAN EARNINGS
0.7/ 100
METRIC RATING
264th/ 347
METRIC RANK
$49,501
MEDIAN EARNINGS
98.7/ 100
METRIC RATING
103rd/ 347
METRIC RANK
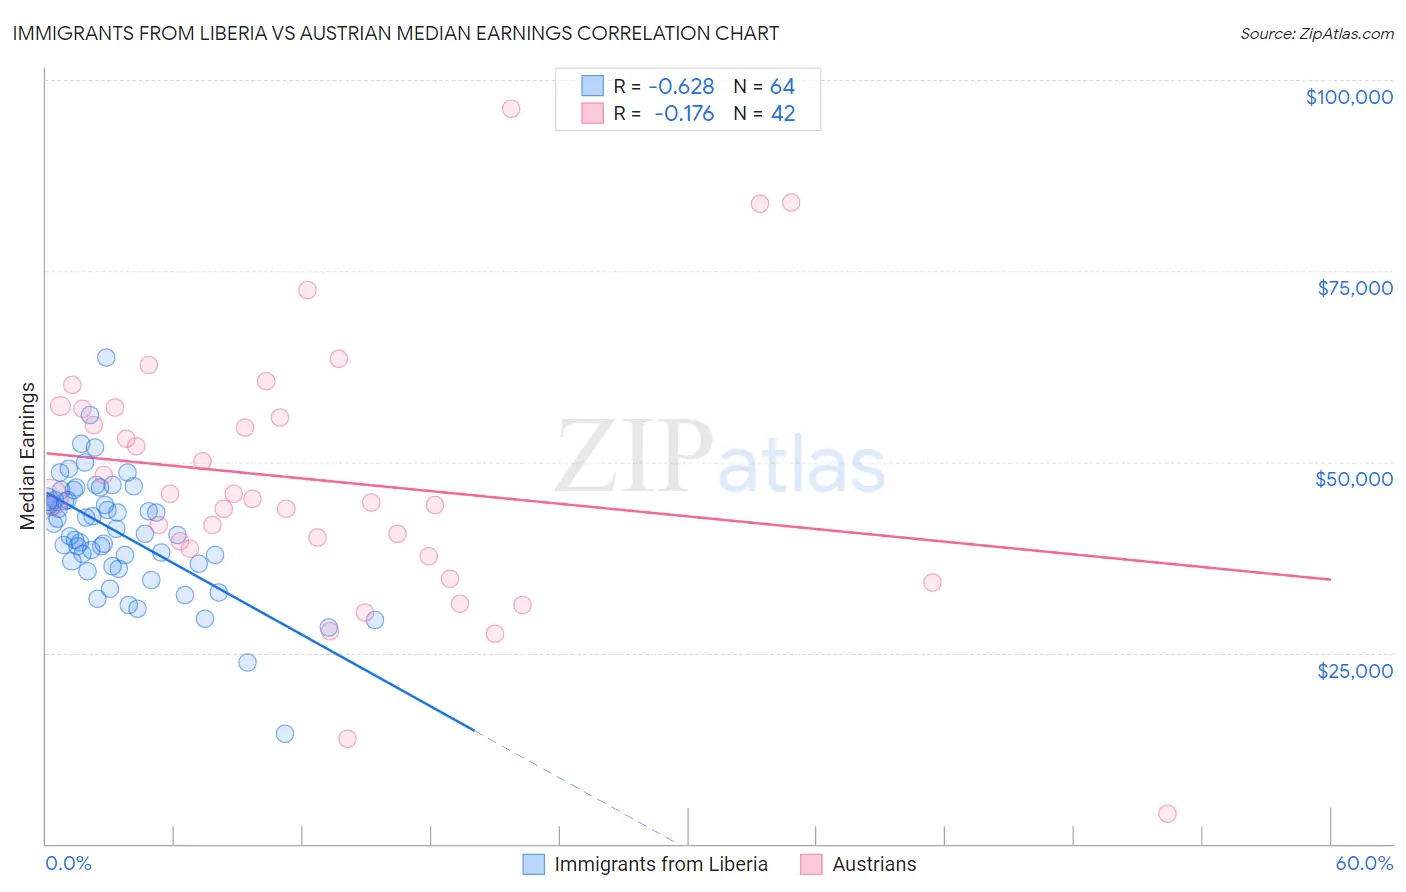
Immigrants from Liberia vs Austrian Median Earnings Correlation Chart
The statistical analysis conducted on geographies consisting of 135,295,960 people shows a significant negative correlation between the proportion of Immigrants from Liberia and median earnings in the United States with a correlation coefficient (R) of -0.628 and weighted average of $42,923. Similarly, the statistical analysis conducted on geographies consisting of 452,042,983 people shows a poor negative correlation between the proportion of Austrians and median earnings in the United States with a correlation coefficient (R) of -0.176 and weighted average of $49,501, a difference of 15.3%.
Median Earnings Correlation Summary
| Measurement | Immigrants from Liberia | Austrian |
| Minimum | $14,336 | $3,902 |
| Maximum | $63,608 | $96,250 |
| Range | $49,272 | $92,348 |
| Mean | $40,857 | $47,542 |
| Median | $41,575 | $45,255 |
| Interquartile 25% (IQ1) | $36,787 | $38,609 |
| Interquartile 75% (IQ3) | $45,056 | $56,967 |
| Interquartile Range (IQR) | $8,269 | $18,358 |
| Standard Deviation (Sample) | $7,722 | $17,409 |
| Standard Deviation (Population) | $7,661 | $17,200 |
Similar Demographics by Median Earnings
Demographics Similar to Immigrants from Liberia by Median Earnings
In terms of median earnings, the demographic groups most similar to Immigrants from Liberia are Salvadoran ($42,912, a difference of 0.030%), Immigrants from Laos ($42,884, a difference of 0.090%), Inupiat ($43,000, a difference of 0.18%), Immigrants from Jamaica ($43,026, a difference of 0.24%), and Nicaraguan ($43,026, a difference of 0.24%).
| Demographics | Rating | Rank | Median Earnings |
| Jamaicans | 1.3 /100 | #257 | Tragic $43,343 |
| French American Indians | 1.3 /100 | #258 | Tragic $43,333 |
| German Russians | 1.1 /100 | #259 | Tragic $43,200 |
| Immigrants | Somalia | 0.9 /100 | #260 | Tragic $43,100 |
| Immigrants | Jamaica | 0.8 /100 | #261 | Tragic $43,026 |
| Nicaraguans | 0.8 /100 | #262 | Tragic $43,026 |
| Inupiat | 0.8 /100 | #263 | Tragic $43,000 |
| Immigrants | Liberia | 0.7 /100 | #264 | Tragic $42,923 |
| Salvadorans | 0.7 /100 | #265 | Tragic $42,912 |
| Immigrants | Laos | 0.7 /100 | #266 | Tragic $42,884 |
| Cree | 0.6 /100 | #267 | Tragic $42,777 |
| Americans | 0.6 /100 | #268 | Tragic $42,742 |
| Belizeans | 0.5 /100 | #269 | Tragic $42,702 |
| Osage | 0.5 /100 | #270 | Tragic $42,651 |
| Pennsylvania Germans | 0.5 /100 | #271 | Tragic $42,615 |
Demographics Similar to Austrians by Median Earnings
In terms of median earnings, the demographic groups most similar to Austrians are Immigrants from Brazil ($49,463, a difference of 0.080%), Ethiopian ($49,572, a difference of 0.14%), Immigrants from Western Asia ($49,389, a difference of 0.23%), Immigrants from Albania ($49,377, a difference of 0.25%), and Immigrants from Poland ($49,633, a difference of 0.27%).
| Demographics | Rating | Rank | Median Earnings |
| Immigrants | Lebanon | 99.0 /100 | #96 | Exceptional $49,682 |
| Immigrants | North Macedonia | 98.9 /100 | #97 | Exceptional $49,658 |
| Immigrants | Northern Africa | 98.9 /100 | #98 | Exceptional $49,648 |
| Immigrants | Afghanistan | 98.9 /100 | #99 | Exceptional $49,645 |
| Immigrants | Poland | 98.9 /100 | #100 | Exceptional $49,633 |
| Jordanians | 98.9 /100 | #101 | Exceptional $49,632 |
| Ethiopians | 98.8 /100 | #102 | Exceptional $49,572 |
| Austrians | 98.7 /100 | #103 | Exceptional $49,501 |
| Immigrants | Brazil | 98.6 /100 | #104 | Exceptional $49,463 |
| Immigrants | Western Asia | 98.4 /100 | #105 | Exceptional $49,389 |
| Immigrants | Albania | 98.4 /100 | #106 | Exceptional $49,377 |
| Immigrants | Morocco | 98.4 /100 | #107 | Exceptional $49,368 |
| Palestinians | 98.0 /100 | #108 | Exceptional $49,209 |
| Syrians | 97.1 /100 | #109 | Exceptional $48,934 |
| Immigrants | Ethiopia | 97.1 /100 | #110 | Exceptional $48,924 |