Immigrants from Latvia vs Immigrants from Panama Wage/Income Gap
COMPARE
Immigrants from Latvia
Immigrants from Panama
Wage/Income Gap
Wage/Income Gap Comparison
Immigrants from Latvia
Immigrants from Panama
26.7%
WAGE/INCOME GAP
8.9/ 100
METRIC RATING
220th/ 347
METRIC RANK
23.4%
WAGE/INCOME GAP
99.6/ 100
METRIC RATING
88th/ 347
METRIC RANK
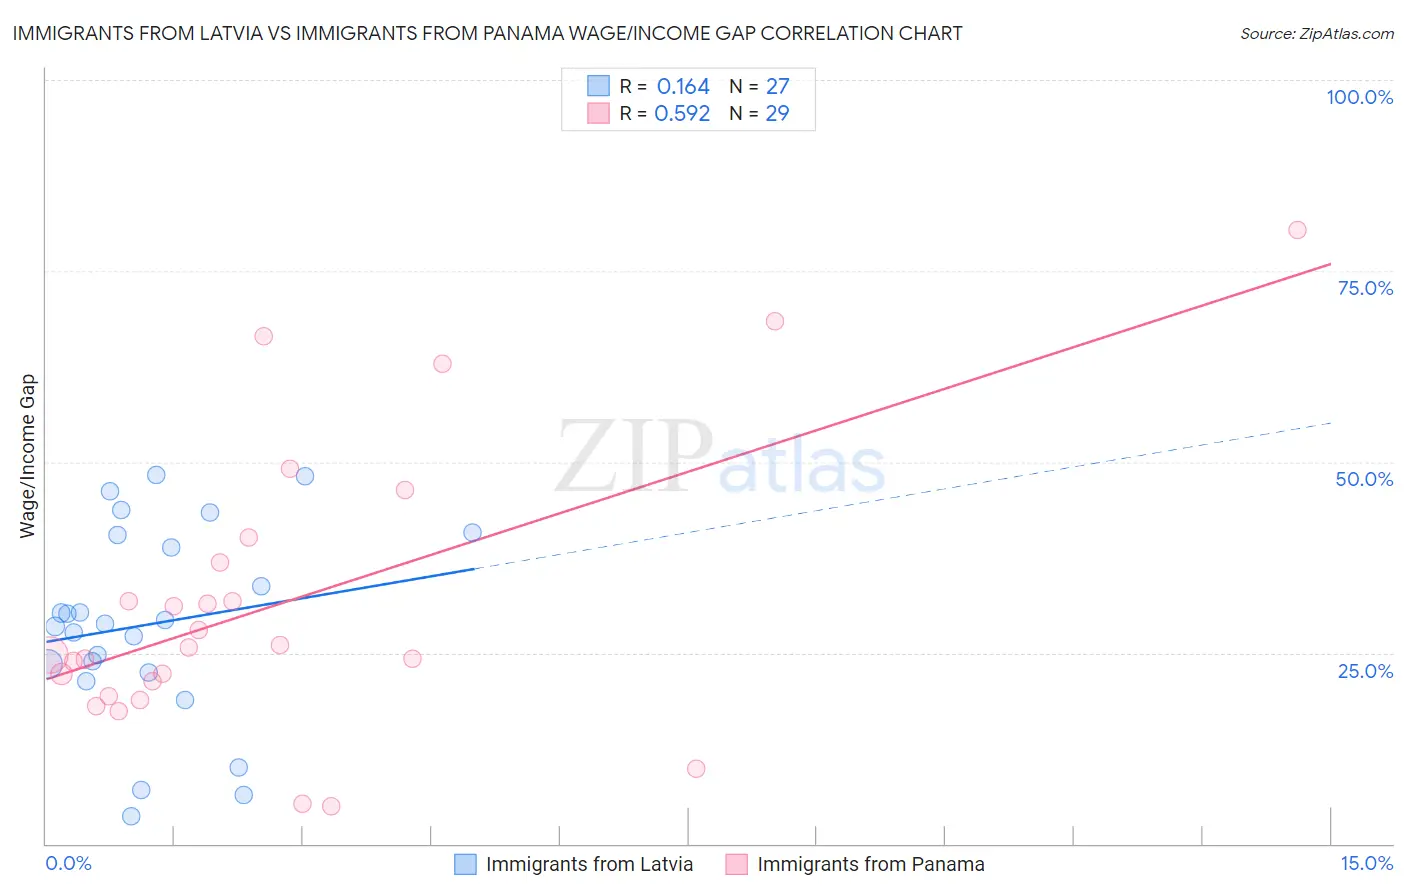
Immigrants from Latvia vs Immigrants from Panama Wage/Income Gap Correlation Chart
The statistical analysis conducted on geographies consisting of 113,720,883 people shows a poor positive correlation between the proportion of Immigrants from Latvia and wage/income gap percentage in the United States with a correlation coefficient (R) of 0.164 and weighted average of 26.7%. Similarly, the statistical analysis conducted on geographies consisting of 221,125,355 people shows a substantial positive correlation between the proportion of Immigrants from Panama and wage/income gap percentage in the United States with a correlation coefficient (R) of 0.592 and weighted average of 23.4%, a difference of 14.3%.
Wage/Income Gap Correlation Summary
| Measurement | Immigrants from Latvia | Immigrants from Panama |
| Minimum | 3.5% | 5.0% |
| Maximum | 48.4% | 80.4% |
| Range | 44.8% | 75.4% |
| Mean | 28.8% | 31.5% |
| Median | 28.9% | 25.7% |
| Interquartile 25% (IQ1) | 22.5% | 20.3% |
| Interquartile 75% (IQ3) | 40.4% | 38.5% |
| Interquartile Range (IQR) | 18.0% | 18.2% |
| Standard Deviation (Sample) | 12.6% | 18.6% |
| Standard Deviation (Population) | 12.4% | 18.3% |
Similar Demographics by Wage/Income Gap
Demographics Similar to Immigrants from Latvia by Wage/Income Gap
In terms of wage/income gap, the demographic groups most similar to Immigrants from Latvia are Immigrants from Poland (26.7%, a difference of 0.010%), Immigrants from Saudi Arabia (26.7%, a difference of 0.040%), Brazilian (26.7%, a difference of 0.070%), Immigrants from Spain (26.8%, a difference of 0.070%), and Bolivian (26.8%, a difference of 0.11%).
| Demographics | Rating | Rank | Wage/Income Gap |
| Immigrants | Iraq | 10.3 /100 | #213 | Poor 26.7% |
| Immigrants | China | 10.3 /100 | #214 | Poor 26.7% |
| Yugoslavians | 9.7 /100 | #215 | Tragic 26.7% |
| Immigrants | Portugal | 9.5 /100 | #216 | Tragic 26.7% |
| Brazilians | 9.2 /100 | #217 | Tragic 26.7% |
| Immigrants | Saudi Arabia | 9.1 /100 | #218 | Tragic 26.7% |
| Immigrants | Poland | 8.9 /100 | #219 | Tragic 26.7% |
| Immigrants | Latvia | 8.9 /100 | #220 | Tragic 26.7% |
| Immigrants | Spain | 8.5 /100 | #221 | Tragic 26.8% |
| Bolivians | 8.3 /100 | #222 | Tragic 26.8% |
| Jordanians | 8.0 /100 | #223 | Tragic 26.8% |
| Immigrants | Argentina | 7.2 /100 | #224 | Tragic 26.8% |
| Immigrants | Ireland | 6.5 /100 | #225 | Tragic 26.9% |
| Asians | 5.9 /100 | #226 | Tragic 26.9% |
| Spaniards | 5.6 /100 | #227 | Tragic 27.0% |
Demographics Similar to Immigrants from Panama by Wage/Income Gap
In terms of wage/income gap, the demographic groups most similar to Immigrants from Panama are Marshallese (23.4%, a difference of 0.090%), Nicaraguan (23.4%, a difference of 0.10%), Arapaho (23.5%, a difference of 0.24%), Yuman (23.3%, a difference of 0.32%), and Cheyenne (23.3%, a difference of 0.37%).
| Demographics | Rating | Rank | Wage/Income Gap |
| Bermudans | 99.8 /100 | #81 | Exceptional 23.1% |
| Central Americans | 99.8 /100 | #82 | Exceptional 23.1% |
| Immigrants | Africa | 99.8 /100 | #83 | Exceptional 23.2% |
| Cubans | 99.7 /100 | #84 | Exceptional 23.3% |
| Immigrants | Cambodia | 99.7 /100 | #85 | Exceptional 23.3% |
| Cheyenne | 99.7 /100 | #86 | Exceptional 23.3% |
| Yuman | 99.7 /100 | #87 | Exceptional 23.3% |
| Immigrants | Panama | 99.6 /100 | #88 | Exceptional 23.4% |
| Marshallese | 99.6 /100 | #89 | Exceptional 23.4% |
| Nicaraguans | 99.6 /100 | #90 | Exceptional 23.4% |
| Arapaho | 99.6 /100 | #91 | Exceptional 23.5% |
| Immigrants | Honduras | 99.5 /100 | #92 | Exceptional 23.5% |
| Immigrants | Cabo Verde | 99.5 /100 | #93 | Exceptional 23.6% |
| Hondurans | 99.5 /100 | #94 | Exceptional 23.6% |
| Cape Verdeans | 99.4 /100 | #95 | Exceptional 23.6% |