Immigrants from Latvia vs Immigrants from Sri Lanka Wage/Income Gap
COMPARE
Immigrants from Latvia
Immigrants from Sri Lanka
Wage/Income Gap
Wage/Income Gap Comparison
Immigrants from Latvia
Immigrants from Sri Lanka
26.7%
WAGE/INCOME GAP
8.9/ 100
METRIC RATING
220th/ 347
METRIC RANK
27.1%
WAGE/INCOME GAP
3.7/ 100
METRIC RATING
242nd/ 347
METRIC RANK
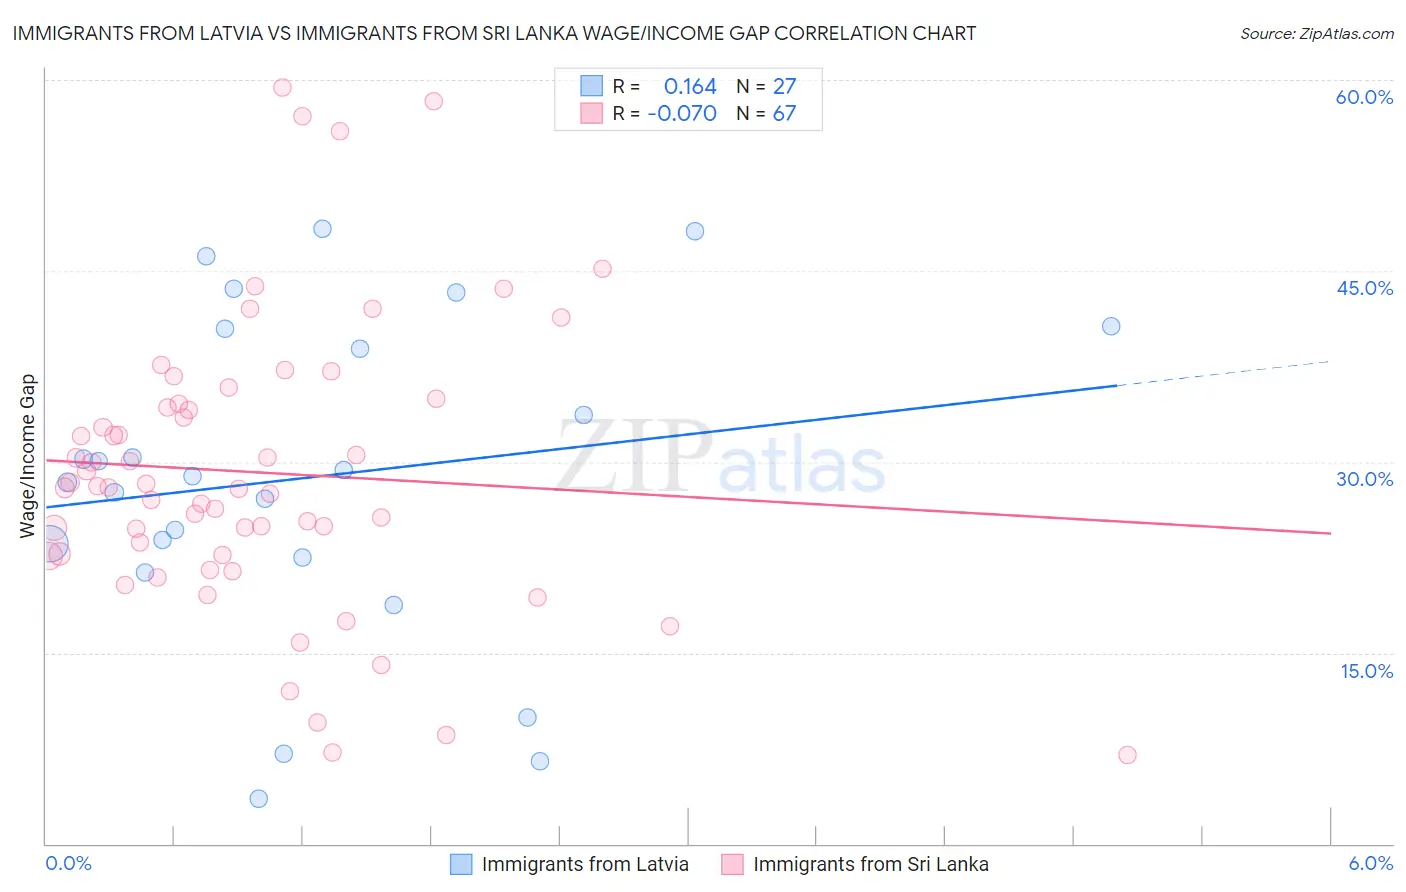
Immigrants from Latvia vs Immigrants from Sri Lanka Wage/Income Gap Correlation Chart
The statistical analysis conducted on geographies consisting of 113,720,883 people shows a poor positive correlation between the proportion of Immigrants from Latvia and wage/income gap percentage in the United States with a correlation coefficient (R) of 0.164 and weighted average of 26.7%. Similarly, the statistical analysis conducted on geographies consisting of 149,684,649 people shows a slight negative correlation between the proportion of Immigrants from Sri Lanka and wage/income gap percentage in the United States with a correlation coefficient (R) of -0.070 and weighted average of 27.1%, a difference of 1.5%.
Wage/Income Gap Correlation Summary
| Measurement | Immigrants from Latvia | Immigrants from Sri Lanka |
| Minimum | 3.5% | 7.0% |
| Maximum | 48.4% | 59.4% |
| Range | 44.8% | 52.4% |
| Mean | 28.8% | 29.2% |
| Median | 28.9% | 28.0% |
| Interquartile 25% (IQ1) | 22.5% | 22.7% |
| Interquartile 75% (IQ3) | 40.4% | 34.6% |
| Interquartile Range (IQR) | 18.0% | 11.8% |
| Standard Deviation (Sample) | 12.6% | 11.3% |
| Standard Deviation (Population) | 12.4% | 11.2% |
Similar Demographics by Wage/Income Gap
Demographics Similar to Immigrants from Latvia by Wage/Income Gap
In terms of wage/income gap, the demographic groups most similar to Immigrants from Latvia are Immigrants from Poland (26.7%, a difference of 0.010%), Immigrants from Saudi Arabia (26.7%, a difference of 0.040%), Brazilian (26.7%, a difference of 0.070%), Immigrants from Spain (26.8%, a difference of 0.070%), and Bolivian (26.8%, a difference of 0.11%).
| Demographics | Rating | Rank | Wage/Income Gap |
| Immigrants | Iraq | 10.3 /100 | #213 | Poor 26.7% |
| Immigrants | China | 10.3 /100 | #214 | Poor 26.7% |
| Yugoslavians | 9.7 /100 | #215 | Tragic 26.7% |
| Immigrants | Portugal | 9.5 /100 | #216 | Tragic 26.7% |
| Brazilians | 9.2 /100 | #217 | Tragic 26.7% |
| Immigrants | Saudi Arabia | 9.1 /100 | #218 | Tragic 26.7% |
| Immigrants | Poland | 8.9 /100 | #219 | Tragic 26.7% |
| Immigrants | Latvia | 8.9 /100 | #220 | Tragic 26.7% |
| Immigrants | Spain | 8.5 /100 | #221 | Tragic 26.8% |
| Bolivians | 8.3 /100 | #222 | Tragic 26.8% |
| Jordanians | 8.0 /100 | #223 | Tragic 26.8% |
| Immigrants | Argentina | 7.2 /100 | #224 | Tragic 26.8% |
| Immigrants | Ireland | 6.5 /100 | #225 | Tragic 26.9% |
| Asians | 5.9 /100 | #226 | Tragic 26.9% |
| Spaniards | 5.6 /100 | #227 | Tragic 27.0% |
Demographics Similar to Immigrants from Sri Lanka by Wage/Income Gap
In terms of wage/income gap, the demographic groups most similar to Immigrants from Sri Lanka are Spanish (27.1%, a difference of 0.010%), Creek (27.1%, a difference of 0.050%), Immigrants from Europe (27.1%, a difference of 0.070%), Chickasaw (27.2%, a difference of 0.080%), and Immigrants from the Azores (27.2%, a difference of 0.090%).
| Demographics | Rating | Rank | Wage/Income Gap |
| Immigrants | Hungary | 4.8 /100 | #235 | Tragic 27.0% |
| Immigrants | Romania | 4.8 /100 | #236 | Tragic 27.0% |
| Immigrants | Eastern Asia | 4.4 /100 | #237 | Tragic 27.1% |
| Osage | 4.4 /100 | #238 | Tragic 27.1% |
| Estonians | 4.3 /100 | #239 | Tragic 27.1% |
| Immigrants | Europe | 3.8 /100 | #240 | Tragic 27.1% |
| Creek | 3.8 /100 | #241 | Tragic 27.1% |
| Immigrants | Sri Lanka | 3.7 /100 | #242 | Tragic 27.1% |
| Spanish | 3.6 /100 | #243 | Tragic 27.1% |
| Chickasaw | 3.5 /100 | #244 | Tragic 27.2% |
| Immigrants | Azores | 3.5 /100 | #245 | Tragic 27.2% |
| Immigrants | Nonimmigrants | 3.3 /100 | #246 | Tragic 27.2% |
| Celtics | 2.8 /100 | #247 | Tragic 27.3% |
| Cypriots | 2.8 /100 | #248 | Tragic 27.3% |
| Carpatho Rusyns | 2.7 /100 | #249 | Tragic 27.3% |