Immigrants from Latvia vs Immigrants from Panama Hearing Disability
COMPARE
Immigrants from Latvia
Immigrants from Panama
Hearing Disability
Hearing Disability Comparison
Immigrants from Latvia
Immigrants from Panama
3.1%
HEARING DISABILITY
12.7/ 100
METRIC RATING
208th/ 347
METRIC RANK
2.9%
HEARING DISABILITY
76.9/ 100
METRIC RATING
149th/ 347
METRIC RANK
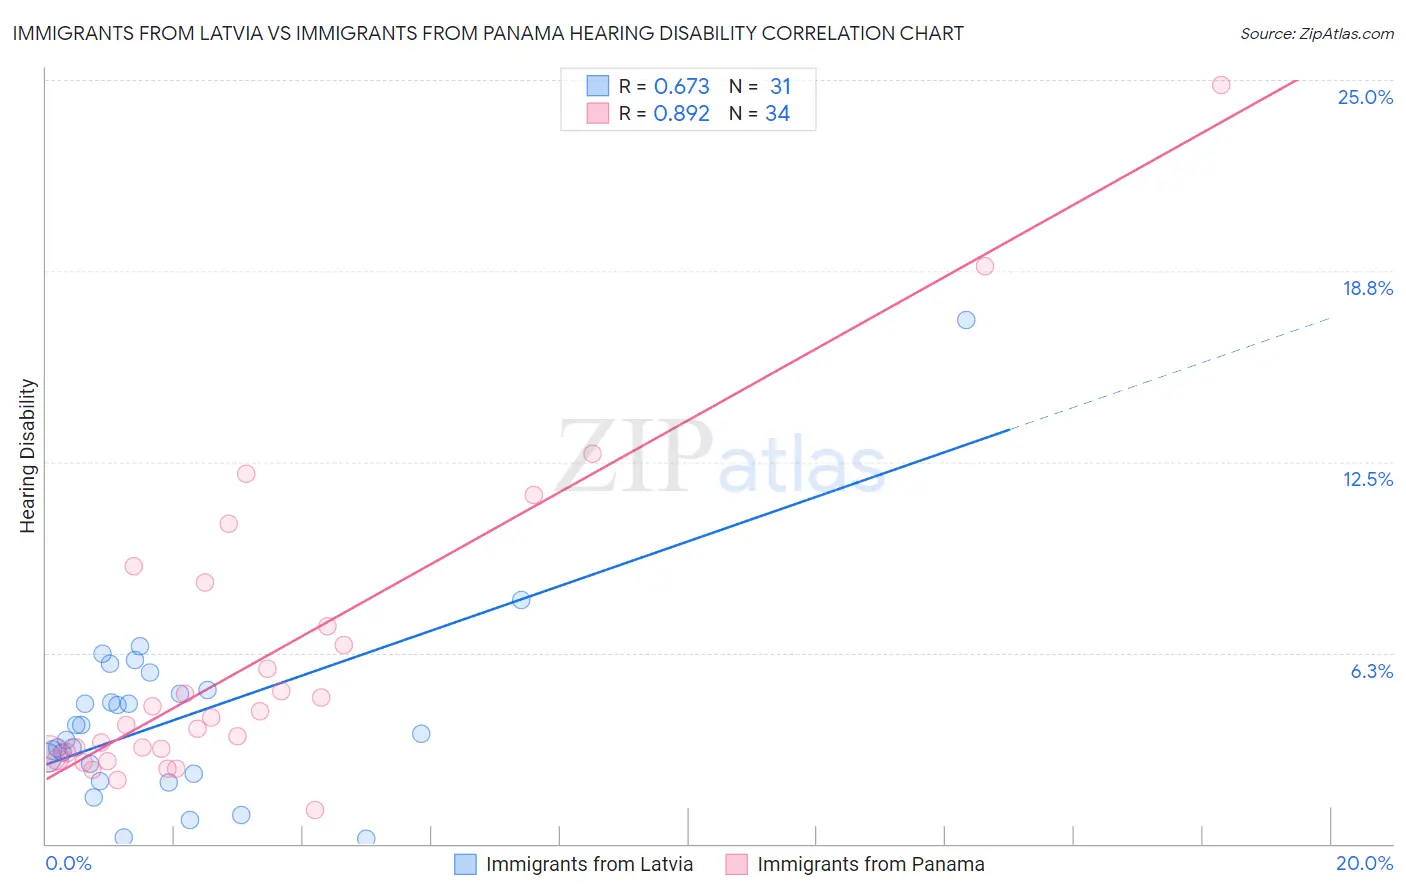
Immigrants from Latvia vs Immigrants from Panama Hearing Disability Correlation Chart
The statistical analysis conducted on geographies consisting of 113,736,493 people shows a significant positive correlation between the proportion of Immigrants from Latvia and percentage of population with hearing disability in the United States with a correlation coefficient (R) of 0.673 and weighted average of 3.1%. Similarly, the statistical analysis conducted on geographies consisting of 221,167,736 people shows a very strong positive correlation between the proportion of Immigrants from Panama and percentage of population with hearing disability in the United States with a correlation coefficient (R) of 0.892 and weighted average of 2.9%, a difference of 7.6%.
Hearing Disability Correlation Summary
| Measurement | Immigrants from Latvia | Immigrants from Panama |
| Minimum | 0.16% | 1.1% |
| Maximum | 17.1% | 24.8% |
| Range | 17.0% | 23.7% |
| Mean | 4.1% | 6.0% |
| Median | 3.6% | 4.0% |
| Interquartile 25% (IQ1) | 2.3% | 3.0% |
| Interquartile 75% (IQ3) | 5.0% | 7.1% |
| Interquartile Range (IQR) | 2.7% | 4.1% |
| Standard Deviation (Sample) | 3.1% | 5.1% |
| Standard Deviation (Population) | 3.0% | 5.0% |
Similar Demographics by Hearing Disability
Demographics Similar to Immigrants from Latvia by Hearing Disability
In terms of hearing disability, the demographic groups most similar to Immigrants from Latvia are Immigrants from Hungary (3.1%, a difference of 0.040%), Cape Verdean (3.1%, a difference of 0.090%), Romanian (3.1%, a difference of 0.13%), Pakistani (3.1%, a difference of 0.33%), and Hispanic or Latino (3.1%, a difference of 0.46%).
| Demographics | Rating | Rank | Hearing Disability |
| Iraqis | 19.0 /100 | #201 | Poor 3.1% |
| Immigrants | Thailand | 16.4 /100 | #202 | Poor 3.1% |
| Immigrants | Denmark | 16.2 /100 | #203 | Poor 3.1% |
| Immigrants | Czechoslovakia | 15.9 /100 | #204 | Poor 3.1% |
| Alsatians | 15.9 /100 | #205 | Poor 3.1% |
| Eastern Europeans | 15.5 /100 | #206 | Poor 3.1% |
| Hispanics or Latinos | 15.1 /100 | #207 | Poor 3.1% |
| Immigrants | Latvia | 12.7 /100 | #208 | Poor 3.1% |
| Immigrants | Hungary | 12.5 /100 | #209 | Poor 3.1% |
| Cape Verdeans | 12.2 /100 | #210 | Poor 3.1% |
| Romanians | 12.1 /100 | #211 | Poor 3.1% |
| Pakistanis | 11.1 /100 | #212 | Poor 3.1% |
| Immigrants | Iraq | 10.5 /100 | #213 | Poor 3.1% |
| Australians | 8.1 /100 | #214 | Tragic 3.2% |
| Bangladeshis | 8.1 /100 | #215 | Tragic 3.2% |
Demographics Similar to Immigrants from Panama by Hearing Disability
In terms of hearing disability, the demographic groups most similar to Immigrants from Panama are Immigrants from Russia (2.9%, a difference of 0.11%), Tongan (2.9%, a difference of 0.25%), Brazilian (2.9%, a difference of 0.26%), Immigrants from Congo (2.9%, a difference of 0.28%), and Immigrants from Bulgaria (2.9%, a difference of 0.33%).
| Demographics | Rating | Rank | Hearing Disability |
| Laotians | 81.1 /100 | #142 | Excellent 2.9% |
| Immigrants | Bahamas | 80.9 /100 | #143 | Excellent 2.9% |
| Immigrants | Bulgaria | 79.2 /100 | #144 | Good 2.9% |
| Immigrants | Congo | 78.9 /100 | #145 | Good 2.9% |
| Brazilians | 78.7 /100 | #146 | Good 2.9% |
| Tongans | 78.6 /100 | #147 | Good 2.9% |
| Immigrants | Russia | 77.7 /100 | #148 | Good 2.9% |
| Immigrants | Panama | 76.9 /100 | #149 | Good 2.9% |
| Palestinians | 73.6 /100 | #150 | Good 2.9% |
| Immigrants | France | 73.1 /100 | #151 | Good 2.9% |
| Immigrants | Lithuania | 73.0 /100 | #152 | Good 2.9% |
| Sudanese | 72.1 /100 | #153 | Good 2.9% |
| Immigrants | Lebanon | 71.5 /100 | #154 | Good 2.9% |
| Costa Ricans | 71.4 /100 | #155 | Good 2.9% |
| Immigrants | Poland | 70.2 /100 | #156 | Good 2.9% |