Immigrants from Latvia vs Immigrants from Kenya Wage/Income Gap
COMPARE
Immigrants from Latvia
Immigrants from Kenya
Wage/Income Gap
Wage/Income Gap Comparison
Immigrants from Latvia
Immigrants from Kenya
26.7%
WAGE/INCOME GAP
8.9/ 100
METRIC RATING
220th/ 347
METRIC RANK
24.4%
WAGE/INCOME GAP
96.4/ 100
METRIC RATING
115th/ 347
METRIC RANK
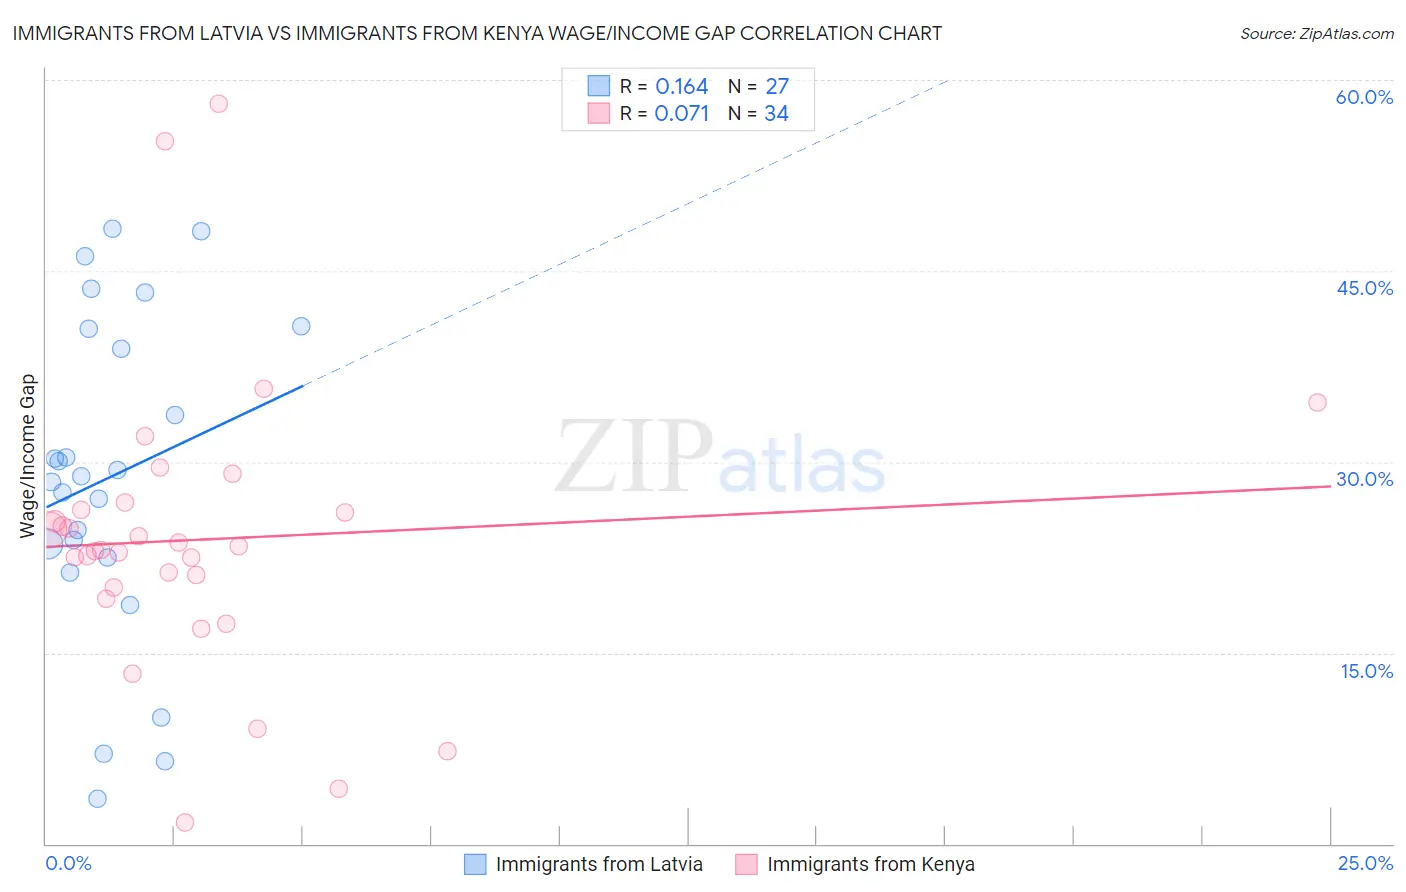
Immigrants from Latvia vs Immigrants from Kenya Wage/Income Gap Correlation Chart
The statistical analysis conducted on geographies consisting of 113,720,883 people shows a poor positive correlation between the proportion of Immigrants from Latvia and wage/income gap percentage in the United States with a correlation coefficient (R) of 0.164 and weighted average of 26.7%. Similarly, the statistical analysis conducted on geographies consisting of 218,055,020 people shows a slight positive correlation between the proportion of Immigrants from Kenya and wage/income gap percentage in the United States with a correlation coefficient (R) of 0.071 and weighted average of 24.4%, a difference of 9.7%.
Wage/Income Gap Correlation Summary
| Measurement | Immigrants from Latvia | Immigrants from Kenya |
| Minimum | 3.5% | 1.6% |
| Maximum | 48.4% | 58.2% |
| Range | 44.8% | 56.5% |
| Mean | 28.8% | 23.9% |
| Median | 28.9% | 23.2% |
| Interquartile 25% (IQ1) | 22.5% | 20.1% |
| Interquartile 75% (IQ3) | 40.4% | 26.2% |
| Interquartile Range (IQR) | 18.0% | 6.1% |
| Standard Deviation (Sample) | 12.6% | 11.3% |
| Standard Deviation (Population) | 12.4% | 11.1% |
Similar Demographics by Wage/Income Gap
Demographics Similar to Immigrants from Latvia by Wage/Income Gap
In terms of wage/income gap, the demographic groups most similar to Immigrants from Latvia are Immigrants from Poland (26.7%, a difference of 0.010%), Immigrants from Saudi Arabia (26.7%, a difference of 0.040%), Brazilian (26.7%, a difference of 0.070%), Immigrants from Spain (26.8%, a difference of 0.070%), and Bolivian (26.8%, a difference of 0.11%).
| Demographics | Rating | Rank | Wage/Income Gap |
| Immigrants | Iraq | 10.3 /100 | #213 | Poor 26.7% |
| Immigrants | China | 10.3 /100 | #214 | Poor 26.7% |
| Yugoslavians | 9.7 /100 | #215 | Tragic 26.7% |
| Immigrants | Portugal | 9.5 /100 | #216 | Tragic 26.7% |
| Brazilians | 9.2 /100 | #217 | Tragic 26.7% |
| Immigrants | Saudi Arabia | 9.1 /100 | #218 | Tragic 26.7% |
| Immigrants | Poland | 8.9 /100 | #219 | Tragic 26.7% |
| Immigrants | Latvia | 8.9 /100 | #220 | Tragic 26.7% |
| Immigrants | Spain | 8.5 /100 | #221 | Tragic 26.8% |
| Bolivians | 8.3 /100 | #222 | Tragic 26.8% |
| Jordanians | 8.0 /100 | #223 | Tragic 26.8% |
| Immigrants | Argentina | 7.2 /100 | #224 | Tragic 26.8% |
| Immigrants | Ireland | 6.5 /100 | #225 | Tragic 26.9% |
| Asians | 5.9 /100 | #226 | Tragic 26.9% |
| Spaniards | 5.6 /100 | #227 | Tragic 27.0% |
Demographics Similar to Immigrants from Kenya by Wage/Income Gap
In terms of wage/income gap, the demographic groups most similar to Immigrants from Kenya are Panamanian (24.4%, a difference of 0.060%), Alaska Native (24.4%, a difference of 0.17%), Immigrants from Afghanistan (24.4%, a difference of 0.23%), Sioux (24.3%, a difference of 0.26%), and Immigrants from Micronesia (24.4%, a difference of 0.26%).
| Demographics | Rating | Rank | Wage/Income Gap |
| Immigrants | Albania | 98.4 /100 | #108 | Exceptional 24.0% |
| Ugandans | 98.3 /100 | #109 | Exceptional 24.1% |
| Immigrants | Morocco | 98.1 /100 | #110 | Exceptional 24.1% |
| Soviet Union | 97.6 /100 | #111 | Exceptional 24.2% |
| Immigrants | Colombia | 97.0 /100 | #112 | Exceptional 24.3% |
| Sioux | 96.9 /100 | #113 | Exceptional 24.3% |
| Panamanians | 96.5 /100 | #114 | Exceptional 24.4% |
| Immigrants | Kenya | 96.4 /100 | #115 | Exceptional 24.4% |
| Alaska Natives | 96.0 /100 | #116 | Exceptional 24.4% |
| Immigrants | Afghanistan | 95.9 /100 | #117 | Exceptional 24.4% |
| Immigrants | Micronesia | 95.8 /100 | #118 | Exceptional 24.4% |
| Kenyans | 95.8 /100 | #119 | Exceptional 24.5% |
| Cree | 95.6 /100 | #120 | Exceptional 24.5% |
| Immigrants | Thailand | 94.9 /100 | #121 | Exceptional 24.5% |
| Apache | 94.8 /100 | #122 | Exceptional 24.5% |