Immigrants from Laos vs U.S. Virgin Islander Median Earnings
COMPARE
Immigrants from Laos
U.S. Virgin Islander
Median Earnings
Median Earnings Comparison
Immigrants from Laos
U.S. Virgin Islanders
$42,884
MEDIAN EARNINGS
0.7/ 100
METRIC RATING
266th/ 347
METRIC RANK
$41,448
MEDIAN EARNINGS
0.1/ 100
METRIC RATING
292nd/ 347
METRIC RANK
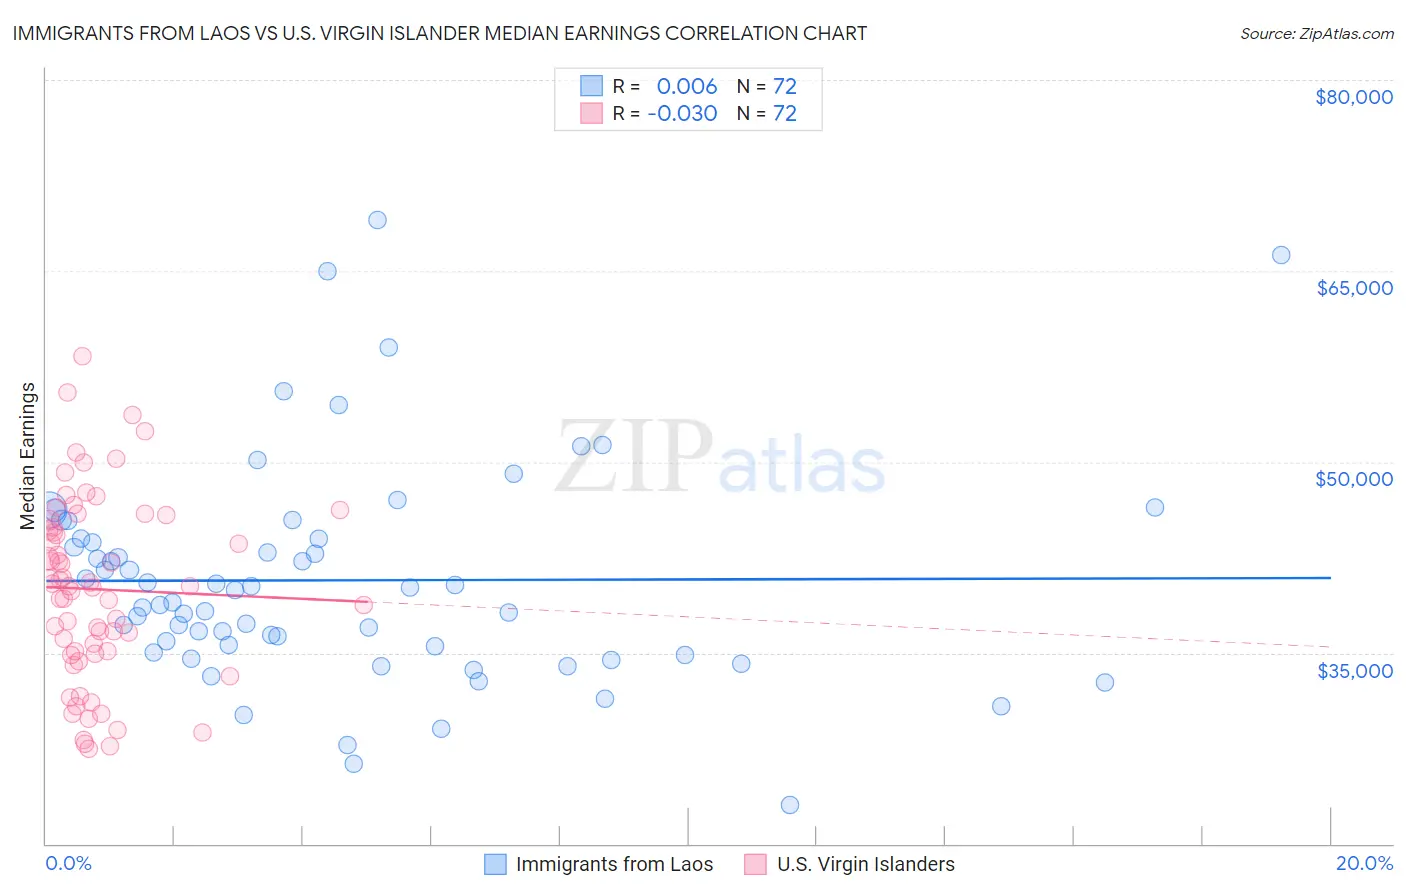
Immigrants from Laos vs U.S. Virgin Islander Median Earnings Correlation Chart
The statistical analysis conducted on geographies consisting of 201,460,807 people shows no correlation between the proportion of Immigrants from Laos and median earnings in the United States with a correlation coefficient (R) of 0.006 and weighted average of $42,884. Similarly, the statistical analysis conducted on geographies consisting of 87,526,165 people shows no correlation between the proportion of U.S. Virgin Islanders and median earnings in the United States with a correlation coefficient (R) of -0.030 and weighted average of $41,448, a difference of 3.5%.
Median Earnings Correlation Summary
| Measurement | Immigrants from Laos | U.S. Virgin Islander |
| Minimum | $23,015 | $27,466 |
| Maximum | $69,036 | $58,251 |
| Range | $46,021 | $30,785 |
| Mean | $40,698 | $39,999 |
| Median | $39,398 | $40,206 |
| Interquartile 25% (IQ1) | $35,289 | $35,022 |
| Interquartile 75% (IQ3) | $43,967 | $45,141 |
| Interquartile Range (IQR) | $8,679 | $10,119 |
| Standard Deviation (Sample) | $8,643 | $7,165 |
| Standard Deviation (Population) | $8,583 | $7,115 |
Similar Demographics by Median Earnings
Demographics Similar to Immigrants from Laos by Median Earnings
In terms of median earnings, the demographic groups most similar to Immigrants from Laos are Salvadoran ($42,912, a difference of 0.060%), Immigrants from Liberia ($42,923, a difference of 0.090%), Cree ($42,777, a difference of 0.25%), Inupiat ($43,000, a difference of 0.27%), and Immigrants from Jamaica ($43,026, a difference of 0.33%).
| Demographics | Rating | Rank | Median Earnings |
| German Russians | 1.1 /100 | #259 | Tragic $43,200 |
| Immigrants | Somalia | 0.9 /100 | #260 | Tragic $43,100 |
| Immigrants | Jamaica | 0.8 /100 | #261 | Tragic $43,026 |
| Nicaraguans | 0.8 /100 | #262 | Tragic $43,026 |
| Inupiat | 0.8 /100 | #263 | Tragic $43,000 |
| Immigrants | Liberia | 0.7 /100 | #264 | Tragic $42,923 |
| Salvadorans | 0.7 /100 | #265 | Tragic $42,912 |
| Immigrants | Laos | 0.7 /100 | #266 | Tragic $42,884 |
| Cree | 0.6 /100 | #267 | Tragic $42,777 |
| Americans | 0.6 /100 | #268 | Tragic $42,742 |
| Belizeans | 0.5 /100 | #269 | Tragic $42,702 |
| Osage | 0.5 /100 | #270 | Tragic $42,651 |
| Pennsylvania Germans | 0.5 /100 | #271 | Tragic $42,615 |
| Iroquois | 0.4 /100 | #272 | Tragic $42,430 |
| Immigrants | Dominica | 0.4 /100 | #273 | Tragic $42,420 |
Demographics Similar to U.S. Virgin Islanders by Median Earnings
In terms of median earnings, the demographic groups most similar to U.S. Virgin Islanders are Central American Indian ($41,474, a difference of 0.060%), Paiute ($41,508, a difference of 0.15%), Comanche ($41,519, a difference of 0.17%), Immigrants from Dominican Republic ($41,554, a difference of 0.26%), and Immigrants from Zaire ($41,325, a difference of 0.30%).
| Demographics | Rating | Rank | Median Earnings |
| Immigrants | Nicaragua | 0.1 /100 | #285 | Tragic $41,737 |
| Mexican American Indians | 0.1 /100 | #286 | Tragic $41,719 |
| Indonesians | 0.1 /100 | #287 | Tragic $41,701 |
| Immigrants | Dominican Republic | 0.1 /100 | #288 | Tragic $41,554 |
| Comanche | 0.1 /100 | #289 | Tragic $41,519 |
| Paiute | 0.1 /100 | #290 | Tragic $41,508 |
| Central American Indians | 0.1 /100 | #291 | Tragic $41,474 |
| U.S. Virgin Islanders | 0.1 /100 | #292 | Tragic $41,448 |
| Immigrants | Zaire | 0.1 /100 | #293 | Tragic $41,325 |
| Potawatomi | 0.1 /100 | #294 | Tragic $41,288 |
| Bangladeshis | 0.1 /100 | #295 | Tragic $41,263 |
| Cherokee | 0.1 /100 | #296 | Tragic $41,252 |
| Guatemalans | 0.1 /100 | #297 | Tragic $41,205 |
| Immigrants | Micronesia | 0.1 /100 | #298 | Tragic $41,133 |
| Immigrants | Caribbean | 0.1 /100 | #299 | Tragic $41,119 |