Immigrants from Laos vs Chippewa Median Earnings
COMPARE
Immigrants from Laos
Chippewa
Median Earnings
Median Earnings Comparison
Immigrants from Laos
Chippewa
$42,884
MEDIAN EARNINGS
0.7/ 100
METRIC RATING
266th/ 347
METRIC RANK
$40,287
MEDIAN EARNINGS
0.0/ 100
METRIC RATING
312th/ 347
METRIC RANK
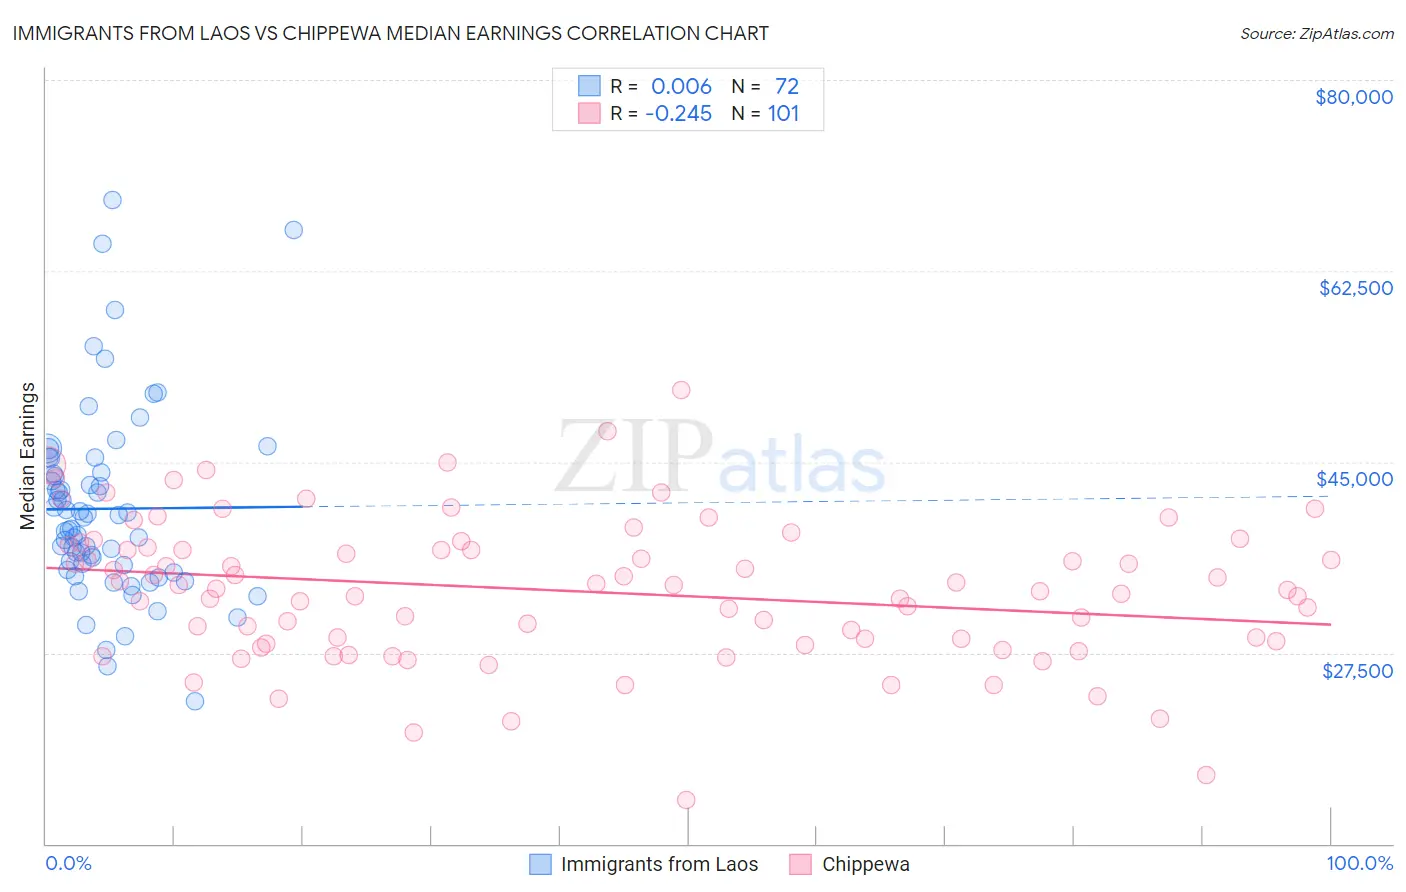
Immigrants from Laos vs Chippewa Median Earnings Correlation Chart
The statistical analysis conducted on geographies consisting of 201,460,807 people shows no correlation between the proportion of Immigrants from Laos and median earnings in the United States with a correlation coefficient (R) of 0.006 and weighted average of $42,884. Similarly, the statistical analysis conducted on geographies consisting of 215,041,296 people shows a weak negative correlation between the proportion of Chippewa and median earnings in the United States with a correlation coefficient (R) of -0.245 and weighted average of $40,287, a difference of 6.5%.
Median Earnings Correlation Summary
| Measurement | Immigrants from Laos | Chippewa |
| Minimum | $23,015 | $14,000 |
| Maximum | $69,036 | $51,563 |
| Range | $46,021 | $37,563 |
| Mean | $40,698 | $33,174 |
| Median | $39,398 | $33,342 |
| Interquartile 25% (IQ1) | $35,289 | $28,488 |
| Interquartile 75% (IQ3) | $43,967 | $37,270 |
| Interquartile Range (IQR) | $8,679 | $8,782 |
| Standard Deviation (Sample) | $8,643 | $6,612 |
| Standard Deviation (Population) | $8,583 | $6,579 |
Similar Demographics by Median Earnings
Demographics Similar to Immigrants from Laos by Median Earnings
In terms of median earnings, the demographic groups most similar to Immigrants from Laos are Salvadoran ($42,912, a difference of 0.060%), Immigrants from Liberia ($42,923, a difference of 0.090%), Cree ($42,777, a difference of 0.25%), Inupiat ($43,000, a difference of 0.27%), and Immigrants from Jamaica ($43,026, a difference of 0.33%).
| Demographics | Rating | Rank | Median Earnings |
| German Russians | 1.1 /100 | #259 | Tragic $43,200 |
| Immigrants | Somalia | 0.9 /100 | #260 | Tragic $43,100 |
| Immigrants | Jamaica | 0.8 /100 | #261 | Tragic $43,026 |
| Nicaraguans | 0.8 /100 | #262 | Tragic $43,026 |
| Inupiat | 0.8 /100 | #263 | Tragic $43,000 |
| Immigrants | Liberia | 0.7 /100 | #264 | Tragic $42,923 |
| Salvadorans | 0.7 /100 | #265 | Tragic $42,912 |
| Immigrants | Laos | 0.7 /100 | #266 | Tragic $42,884 |
| Cree | 0.6 /100 | #267 | Tragic $42,777 |
| Americans | 0.6 /100 | #268 | Tragic $42,742 |
| Belizeans | 0.5 /100 | #269 | Tragic $42,702 |
| Osage | 0.5 /100 | #270 | Tragic $42,651 |
| Pennsylvania Germans | 0.5 /100 | #271 | Tragic $42,615 |
| Iroquois | 0.4 /100 | #272 | Tragic $42,430 |
| Immigrants | Dominica | 0.4 /100 | #273 | Tragic $42,420 |
Demographics Similar to Chippewa by Median Earnings
In terms of median earnings, the demographic groups most similar to Chippewa are Hispanic or Latino ($40,288, a difference of 0.0%), Choctaw ($40,270, a difference of 0.040%), Cheyenne ($40,233, a difference of 0.13%), Seminole ($40,233, a difference of 0.13%), and Immigrants from Honduras ($40,195, a difference of 0.23%).
| Demographics | Rating | Rank | Median Earnings |
| Chickasaw | 0.0 /100 | #305 | Tragic $40,672 |
| Yaqui | 0.0 /100 | #306 | Tragic $40,647 |
| Hondurans | 0.0 /100 | #307 | Tragic $40,638 |
| Cubans | 0.0 /100 | #308 | Tragic $40,619 |
| Immigrants | Haiti | 0.0 /100 | #309 | Tragic $40,550 |
| Apache | 0.0 /100 | #310 | Tragic $40,388 |
| Hispanics or Latinos | 0.0 /100 | #311 | Tragic $40,288 |
| Chippewa | 0.0 /100 | #312 | Tragic $40,287 |
| Choctaw | 0.0 /100 | #313 | Tragic $40,270 |
| Cheyenne | 0.0 /100 | #314 | Tragic $40,233 |
| Seminole | 0.0 /100 | #315 | Tragic $40,233 |
| Immigrants | Honduras | 0.0 /100 | #316 | Tragic $40,195 |
| Fijians | 0.0 /100 | #317 | Tragic $40,193 |
| Dutch West Indians | 0.0 /100 | #318 | Tragic $40,107 |
| Blacks/African Americans | 0.0 /100 | #319 | Tragic $40,085 |