Immigrants from Laos vs Pima Median Earnings
COMPARE
Immigrants from Laos
Pima
Median Earnings
Median Earnings Comparison
Immigrants from Laos
Pima
$42,884
MEDIAN EARNINGS
0.7/ 100
METRIC RATING
266th/ 347
METRIC RANK
$38,285
MEDIAN EARNINGS
0.0/ 100
METRIC RATING
338th/ 347
METRIC RANK
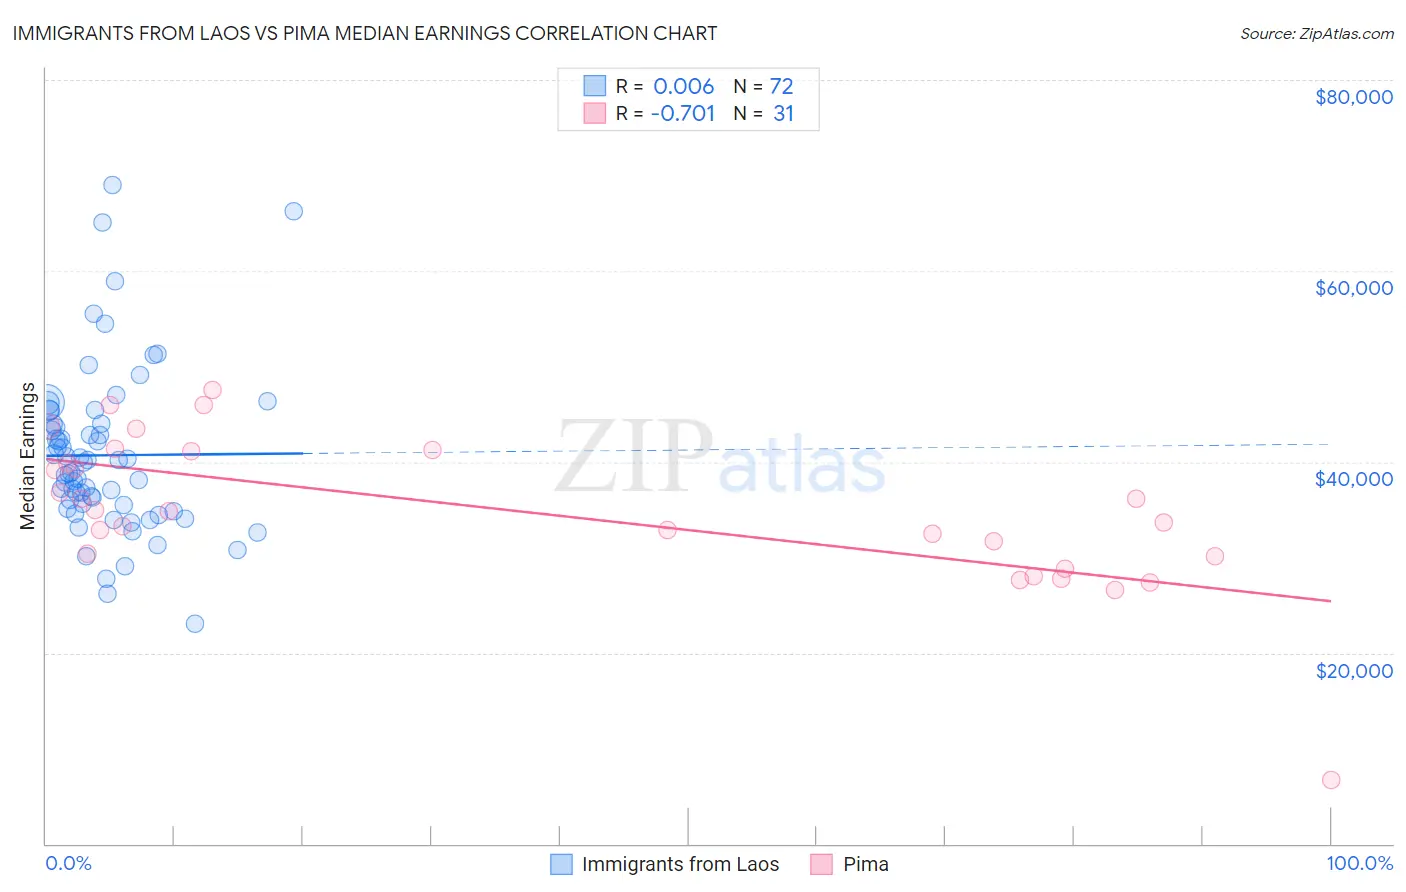
Immigrants from Laos vs Pima Median Earnings Correlation Chart
The statistical analysis conducted on geographies consisting of 201,460,807 people shows no correlation between the proportion of Immigrants from Laos and median earnings in the United States with a correlation coefficient (R) of 0.006 and weighted average of $42,884. Similarly, the statistical analysis conducted on geographies consisting of 61,551,762 people shows a strong negative correlation between the proportion of Pima and median earnings in the United States with a correlation coefficient (R) of -0.701 and weighted average of $38,285, a difference of 12.0%.
Median Earnings Correlation Summary
| Measurement | Immigrants from Laos | Pima |
| Minimum | $23,015 | $6,642 |
| Maximum | $69,036 | $47,578 |
| Range | $46,021 | $40,936 |
| Mean | $40,698 | $34,771 |
| Median | $39,398 | $34,844 |
| Interquartile 25% (IQ1) | $35,289 | $30,058 |
| Interquartile 75% (IQ3) | $43,967 | $41,158 |
| Interquartile Range (IQR) | $8,679 | $11,100 |
| Standard Deviation (Sample) | $8,643 | $8,029 |
| Standard Deviation (Population) | $8,583 | $7,898 |
Similar Demographics by Median Earnings
Demographics Similar to Immigrants from Laos by Median Earnings
In terms of median earnings, the demographic groups most similar to Immigrants from Laos are Salvadoran ($42,912, a difference of 0.060%), Immigrants from Liberia ($42,923, a difference of 0.090%), Cree ($42,777, a difference of 0.25%), Inupiat ($43,000, a difference of 0.27%), and Immigrants from Jamaica ($43,026, a difference of 0.33%).
| Demographics | Rating | Rank | Median Earnings |
| German Russians | 1.1 /100 | #259 | Tragic $43,200 |
| Immigrants | Somalia | 0.9 /100 | #260 | Tragic $43,100 |
| Immigrants | Jamaica | 0.8 /100 | #261 | Tragic $43,026 |
| Nicaraguans | 0.8 /100 | #262 | Tragic $43,026 |
| Inupiat | 0.8 /100 | #263 | Tragic $43,000 |
| Immigrants | Liberia | 0.7 /100 | #264 | Tragic $42,923 |
| Salvadorans | 0.7 /100 | #265 | Tragic $42,912 |
| Immigrants | Laos | 0.7 /100 | #266 | Tragic $42,884 |
| Cree | 0.6 /100 | #267 | Tragic $42,777 |
| Americans | 0.6 /100 | #268 | Tragic $42,742 |
| Belizeans | 0.5 /100 | #269 | Tragic $42,702 |
| Osage | 0.5 /100 | #270 | Tragic $42,651 |
| Pennsylvania Germans | 0.5 /100 | #271 | Tragic $42,615 |
| Iroquois | 0.4 /100 | #272 | Tragic $42,430 |
| Immigrants | Dominica | 0.4 /100 | #273 | Tragic $42,420 |
Demographics Similar to Pima by Median Earnings
In terms of median earnings, the demographic groups most similar to Pima are Immigrants from Cuba ($38,426, a difference of 0.37%), Menominee ($37,884, a difference of 1.1%), Crow ($38,707, a difference of 1.1%), Native/Alaskan ($38,896, a difference of 1.6%), and Spanish American Indian ($38,907, a difference of 1.6%).
| Demographics | Rating | Rank | Median Earnings |
| Immigrants | Mexico | 0.0 /100 | #331 | Tragic $39,114 |
| Yakama | 0.0 /100 | #332 | Tragic $39,107 |
| Houma | 0.0 /100 | #333 | Tragic $38,949 |
| Spanish American Indians | 0.0 /100 | #334 | Tragic $38,907 |
| Natives/Alaskans | 0.0 /100 | #335 | Tragic $38,896 |
| Crow | 0.0 /100 | #336 | Tragic $38,707 |
| Immigrants | Cuba | 0.0 /100 | #337 | Tragic $38,426 |
| Pima | 0.0 /100 | #338 | Tragic $38,285 |
| Menominee | 0.0 /100 | #339 | Tragic $37,884 |
| Navajo | 0.0 /100 | #340 | Tragic $36,999 |
| Lumbee | 0.0 /100 | #341 | Tragic $36,876 |
| Hopi | 0.0 /100 | #342 | Tragic $36,871 |
| Pueblo | 0.0 /100 | #343 | Tragic $36,859 |
| Arapaho | 0.0 /100 | #344 | Tragic $36,586 |
| Tohono O'odham | 0.0 /100 | #345 | Tragic $36,349 |