Immigrants from Laos vs Navajo Median Earnings
COMPARE
Immigrants from Laos
Navajo
Median Earnings
Median Earnings Comparison
Immigrants from Laos
Navajo
$42,884
MEDIAN EARNINGS
0.7/ 100
METRIC RATING
266th/ 347
METRIC RANK
$36,999
MEDIAN EARNINGS
0.0/ 100
METRIC RATING
340th/ 347
METRIC RANK
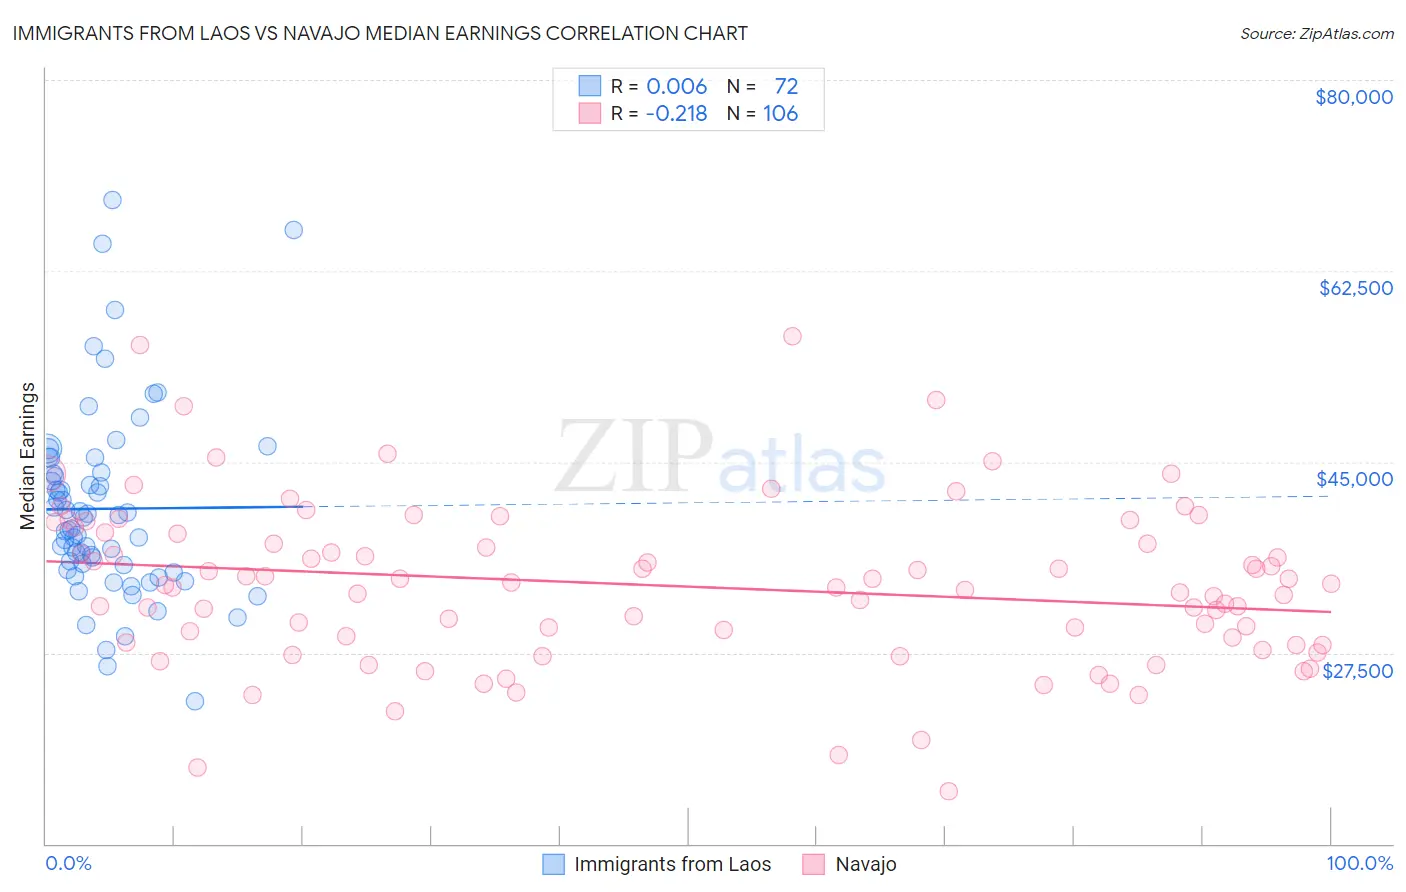
Immigrants from Laos vs Navajo Median Earnings Correlation Chart
The statistical analysis conducted on geographies consisting of 201,460,807 people shows no correlation between the proportion of Immigrants from Laos and median earnings in the United States with a correlation coefficient (R) of 0.006 and weighted average of $42,884. Similarly, the statistical analysis conducted on geographies consisting of 224,830,448 people shows a weak negative correlation between the proportion of Navajo and median earnings in the United States with a correlation coefficient (R) of -0.218 and weighted average of $36,999, a difference of 15.9%.
Median Earnings Correlation Summary
| Measurement | Immigrants from Laos | Navajo |
| Minimum | $23,015 | $14,775 |
| Maximum | $69,036 | $56,536 |
| Range | $46,021 | $41,761 |
| Mean | $40,698 | $33,645 |
| Median | $39,398 | $33,604 |
| Interquartile 25% (IQ1) | $35,289 | $28,471 |
| Interquartile 75% (IQ3) | $43,967 | $38,362 |
| Interquartile Range (IQR) | $8,679 | $9,890 |
| Standard Deviation (Sample) | $8,643 | $7,461 |
| Standard Deviation (Population) | $8,583 | $7,426 |
Similar Demographics by Median Earnings
Demographics Similar to Immigrants from Laos by Median Earnings
In terms of median earnings, the demographic groups most similar to Immigrants from Laos are Salvadoran ($42,912, a difference of 0.060%), Immigrants from Liberia ($42,923, a difference of 0.090%), Cree ($42,777, a difference of 0.25%), Inupiat ($43,000, a difference of 0.27%), and Immigrants from Jamaica ($43,026, a difference of 0.33%).
| Demographics | Rating | Rank | Median Earnings |
| German Russians | 1.1 /100 | #259 | Tragic $43,200 |
| Immigrants | Somalia | 0.9 /100 | #260 | Tragic $43,100 |
| Immigrants | Jamaica | 0.8 /100 | #261 | Tragic $43,026 |
| Nicaraguans | 0.8 /100 | #262 | Tragic $43,026 |
| Inupiat | 0.8 /100 | #263 | Tragic $43,000 |
| Immigrants | Liberia | 0.7 /100 | #264 | Tragic $42,923 |
| Salvadorans | 0.7 /100 | #265 | Tragic $42,912 |
| Immigrants | Laos | 0.7 /100 | #266 | Tragic $42,884 |
| Cree | 0.6 /100 | #267 | Tragic $42,777 |
| Americans | 0.6 /100 | #268 | Tragic $42,742 |
| Belizeans | 0.5 /100 | #269 | Tragic $42,702 |
| Osage | 0.5 /100 | #270 | Tragic $42,651 |
| Pennsylvania Germans | 0.5 /100 | #271 | Tragic $42,615 |
| Iroquois | 0.4 /100 | #272 | Tragic $42,430 |
| Immigrants | Dominica | 0.4 /100 | #273 | Tragic $42,420 |
Demographics Similar to Navajo by Median Earnings
In terms of median earnings, the demographic groups most similar to Navajo are Lumbee ($36,876, a difference of 0.33%), Hopi ($36,871, a difference of 0.35%), Pueblo ($36,859, a difference of 0.38%), Arapaho ($36,586, a difference of 1.1%), and Tohono O'odham ($36,349, a difference of 1.8%).
| Demographics | Rating | Rank | Median Earnings |
| Houma | 0.0 /100 | #333 | Tragic $38,949 |
| Spanish American Indians | 0.0 /100 | #334 | Tragic $38,907 |
| Natives/Alaskans | 0.0 /100 | #335 | Tragic $38,896 |
| Crow | 0.0 /100 | #336 | Tragic $38,707 |
| Immigrants | Cuba | 0.0 /100 | #337 | Tragic $38,426 |
| Pima | 0.0 /100 | #338 | Tragic $38,285 |
| Menominee | 0.0 /100 | #339 | Tragic $37,884 |
| Navajo | 0.0 /100 | #340 | Tragic $36,999 |
| Lumbee | 0.0 /100 | #341 | Tragic $36,876 |
| Hopi | 0.0 /100 | #342 | Tragic $36,871 |
| Pueblo | 0.0 /100 | #343 | Tragic $36,859 |
| Arapaho | 0.0 /100 | #344 | Tragic $36,586 |
| Tohono O'odham | 0.0 /100 | #345 | Tragic $36,349 |
| Yup'ik | 0.0 /100 | #346 | Tragic $35,942 |
| Puerto Ricans | 0.0 /100 | #347 | Tragic $35,560 |