Immigrants from Laos vs Immigrants from Colombia Median Earnings
COMPARE
Immigrants from Laos
Immigrants from Colombia
Median Earnings
Median Earnings Comparison
Immigrants from Laos
Immigrants from Colombia
$42,884
MEDIAN EARNINGS
0.7/ 100
METRIC RATING
266th/ 347
METRIC RANK
$45,550
MEDIAN EARNINGS
22.4/ 100
METRIC RATING
213th/ 347
METRIC RANK
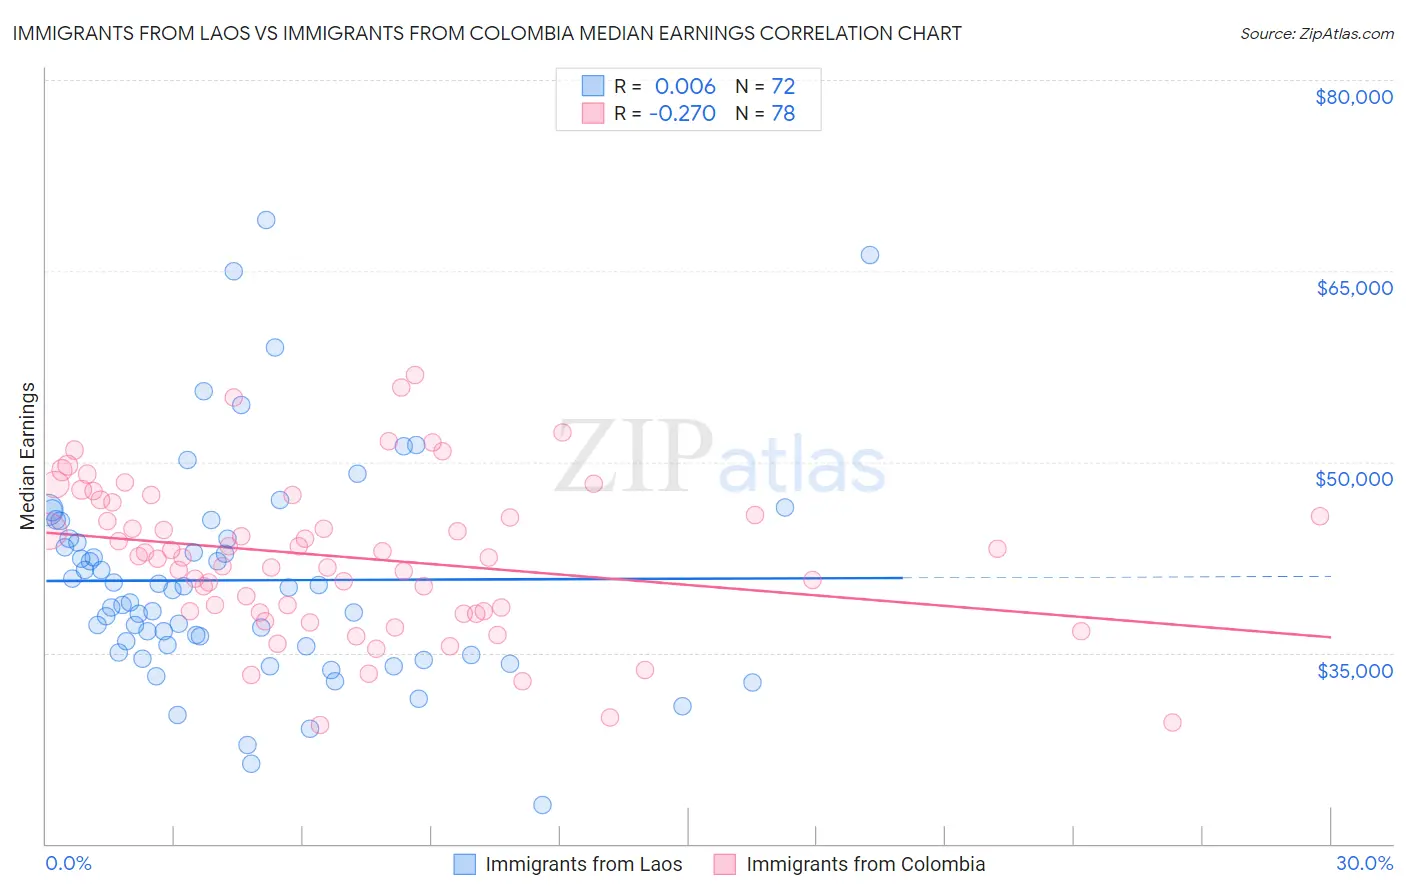
Immigrants from Laos vs Immigrants from Colombia Median Earnings Correlation Chart
The statistical analysis conducted on geographies consisting of 201,460,807 people shows no correlation between the proportion of Immigrants from Laos and median earnings in the United States with a correlation coefficient (R) of 0.006 and weighted average of $42,884. Similarly, the statistical analysis conducted on geographies consisting of 378,647,626 people shows a weak negative correlation between the proportion of Immigrants from Colombia and median earnings in the United States with a correlation coefficient (R) of -0.270 and weighted average of $45,550, a difference of 6.2%.
Median Earnings Correlation Summary
| Measurement | Immigrants from Laos | Immigrants from Colombia |
| Minimum | $23,015 | $29,284 |
| Maximum | $69,036 | $56,800 |
| Range | $46,021 | $27,517 |
| Mean | $40,698 | $42,514 |
| Median | $39,398 | $42,568 |
| Interquartile 25% (IQ1) | $35,289 | $38,241 |
| Interquartile 75% (IQ3) | $43,967 | $46,823 |
| Interquartile Range (IQR) | $8,679 | $8,582 |
| Standard Deviation (Sample) | $8,643 | $5,984 |
| Standard Deviation (Population) | $8,583 | $5,945 |
Similar Demographics by Median Earnings
Demographics Similar to Immigrants from Laos by Median Earnings
In terms of median earnings, the demographic groups most similar to Immigrants from Laos are Salvadoran ($42,912, a difference of 0.060%), Immigrants from Liberia ($42,923, a difference of 0.090%), Cree ($42,777, a difference of 0.25%), Inupiat ($43,000, a difference of 0.27%), and Immigrants from Jamaica ($43,026, a difference of 0.33%).
| Demographics | Rating | Rank | Median Earnings |
| German Russians | 1.1 /100 | #259 | Tragic $43,200 |
| Immigrants | Somalia | 0.9 /100 | #260 | Tragic $43,100 |
| Immigrants | Jamaica | 0.8 /100 | #261 | Tragic $43,026 |
| Nicaraguans | 0.8 /100 | #262 | Tragic $43,026 |
| Inupiat | 0.8 /100 | #263 | Tragic $43,000 |
| Immigrants | Liberia | 0.7 /100 | #264 | Tragic $42,923 |
| Salvadorans | 0.7 /100 | #265 | Tragic $42,912 |
| Immigrants | Laos | 0.7 /100 | #266 | Tragic $42,884 |
| Cree | 0.6 /100 | #267 | Tragic $42,777 |
| Americans | 0.6 /100 | #268 | Tragic $42,742 |
| Belizeans | 0.5 /100 | #269 | Tragic $42,702 |
| Osage | 0.5 /100 | #270 | Tragic $42,651 |
| Pennsylvania Germans | 0.5 /100 | #271 | Tragic $42,615 |
| Iroquois | 0.4 /100 | #272 | Tragic $42,430 |
| Immigrants | Dominica | 0.4 /100 | #273 | Tragic $42,420 |
Demographics Similar to Immigrants from Colombia by Median Earnings
In terms of median earnings, the demographic groups most similar to Immigrants from Colombia are Nigerian ($45,532, a difference of 0.040%), Immigrants from Bangladesh ($45,532, a difference of 0.040%), Immigrants from Grenada ($45,596, a difference of 0.10%), Panamanian ($45,593, a difference of 0.10%), and Bermudan ($45,593, a difference of 0.10%).
| Demographics | Rating | Rank | Median Earnings |
| Immigrants | Ghana | 24.8 /100 | #206 | Fair $45,641 |
| Immigrants | Senegal | 24.0 /100 | #207 | Fair $45,611 |
| Immigrants | Bosnia and Herzegovina | 23.7 /100 | #208 | Fair $45,600 |
| Immigrants | Thailand | 23.7 /100 | #209 | Fair $45,598 |
| Immigrants | Grenada | 23.6 /100 | #210 | Fair $45,596 |
| Panamanians | 23.5 /100 | #211 | Fair $45,593 |
| Bermudans | 23.5 /100 | #212 | Fair $45,593 |
| Immigrants | Colombia | 22.4 /100 | #213 | Fair $45,550 |
| Nigerians | 22.0 /100 | #214 | Fair $45,532 |
| Immigrants | Bangladesh | 22.0 /100 | #215 | Fair $45,532 |
| Guyanese | 20.6 /100 | #216 | Fair $45,470 |
| Tlingit-Haida | 20.5 /100 | #217 | Fair $45,468 |
| Spanish | 19.7 /100 | #218 | Poor $45,432 |
| Dutch | 18.4 /100 | #219 | Poor $45,370 |
| Ecuadorians | 15.3 /100 | #220 | Poor $45,214 |