Immigrants from Laos vs Indian (Asian) Median Earnings
COMPARE
Immigrants from Laos
Indian (Asian)
Median Earnings
Median Earnings Comparison
Immigrants from Laos
Indians (Asian)
$42,884
MEDIAN EARNINGS
0.7/ 100
METRIC RATING
266th/ 347
METRIC RANK
$56,253
MEDIAN EARNINGS
100.0/ 100
METRIC RATING
15th/ 347
METRIC RANK
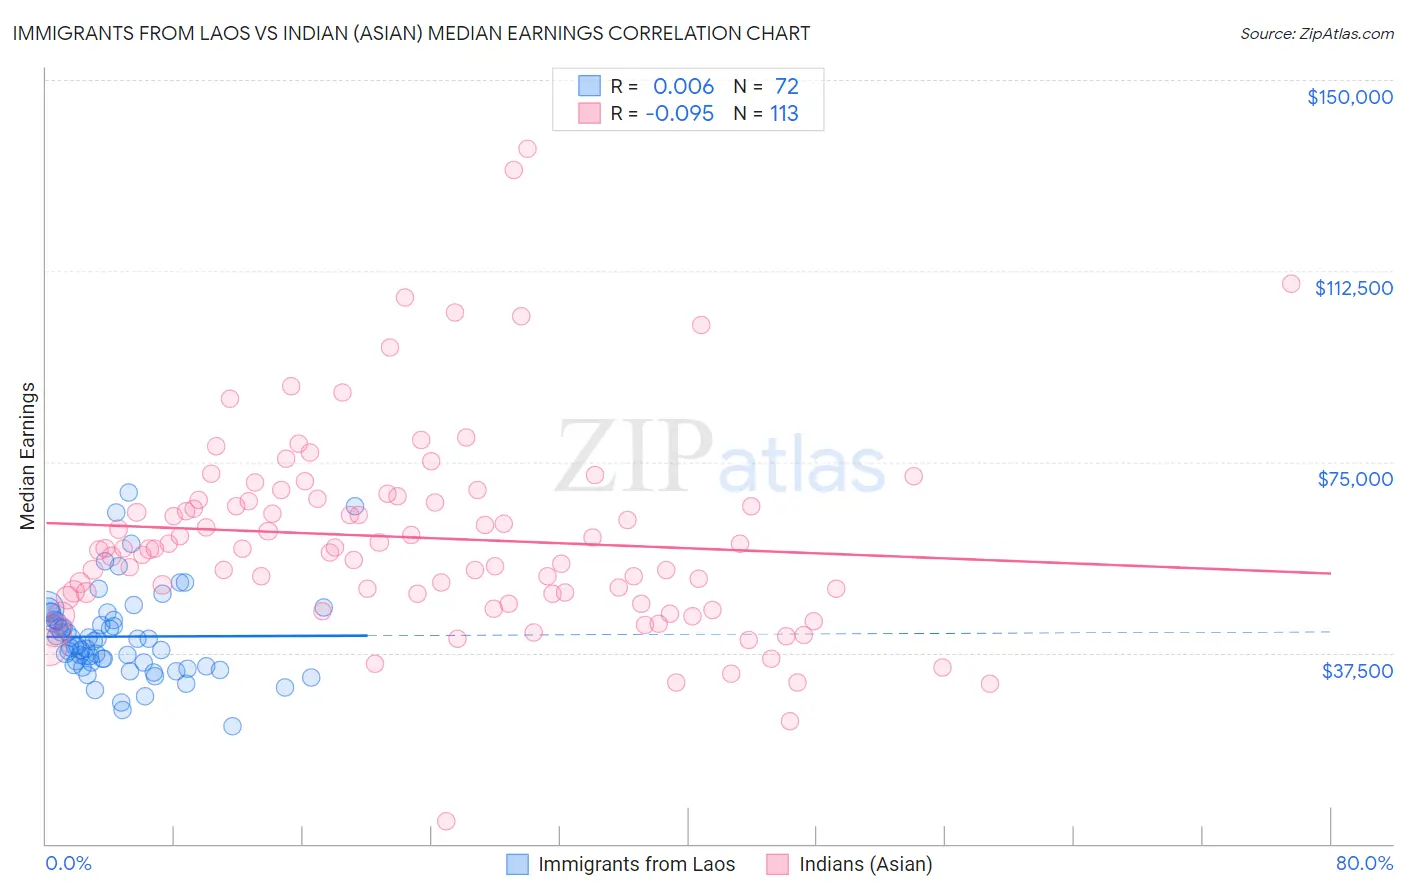
Immigrants from Laos vs Indian (Asian) Median Earnings Correlation Chart
The statistical analysis conducted on geographies consisting of 201,460,807 people shows no correlation between the proportion of Immigrants from Laos and median earnings in the United States with a correlation coefficient (R) of 0.006 and weighted average of $42,884. Similarly, the statistical analysis conducted on geographies consisting of 495,313,309 people shows a slight negative correlation between the proportion of Indians (Asian) and median earnings in the United States with a correlation coefficient (R) of -0.095 and weighted average of $56,253, a difference of 31.2%.
Median Earnings Correlation Summary
| Measurement | Immigrants from Laos | Indian (Asian) |
| Minimum | $23,015 | $4,382 |
| Maximum | $69,036 | $136,388 |
| Range | $46,021 | $132,006 |
| Mean | $40,698 | $60,085 |
| Median | $39,398 | $57,869 |
| Interquartile 25% (IQ1) | $35,289 | $48,728 |
| Interquartile 75% (IQ3) | $43,967 | $67,622 |
| Interquartile Range (IQR) | $8,679 | $18,894 |
| Standard Deviation (Sample) | $8,643 | $20,110 |
| Standard Deviation (Population) | $8,583 | $20,020 |
Similar Demographics by Median Earnings
Demographics Similar to Immigrants from Laos by Median Earnings
In terms of median earnings, the demographic groups most similar to Immigrants from Laos are Salvadoran ($42,912, a difference of 0.060%), Immigrants from Liberia ($42,923, a difference of 0.090%), Cree ($42,777, a difference of 0.25%), Inupiat ($43,000, a difference of 0.27%), and Immigrants from Jamaica ($43,026, a difference of 0.33%).
| Demographics | Rating | Rank | Median Earnings |
| German Russians | 1.1 /100 | #259 | Tragic $43,200 |
| Immigrants | Somalia | 0.9 /100 | #260 | Tragic $43,100 |
| Immigrants | Jamaica | 0.8 /100 | #261 | Tragic $43,026 |
| Nicaraguans | 0.8 /100 | #262 | Tragic $43,026 |
| Inupiat | 0.8 /100 | #263 | Tragic $43,000 |
| Immigrants | Liberia | 0.7 /100 | #264 | Tragic $42,923 |
| Salvadorans | 0.7 /100 | #265 | Tragic $42,912 |
| Immigrants | Laos | 0.7 /100 | #266 | Tragic $42,884 |
| Cree | 0.6 /100 | #267 | Tragic $42,777 |
| Americans | 0.6 /100 | #268 | Tragic $42,742 |
| Belizeans | 0.5 /100 | #269 | Tragic $42,702 |
| Osage | 0.5 /100 | #270 | Tragic $42,651 |
| Pennsylvania Germans | 0.5 /100 | #271 | Tragic $42,615 |
| Iroquois | 0.4 /100 | #272 | Tragic $42,430 |
| Immigrants | Dominica | 0.4 /100 | #273 | Tragic $42,420 |
Demographics Similar to Indians (Asian) by Median Earnings
In terms of median earnings, the demographic groups most similar to Indians (Asian) are Immigrants from Australia ($56,305, a difference of 0.090%), Immigrants from Eastern Asia ($56,183, a difference of 0.12%), Immigrants from China ($56,638, a difference of 0.68%), Immigrants from Ireland ($56,854, a difference of 1.1%), and Immigrants from Israel ($57,034, a difference of 1.4%).
| Demographics | Rating | Rank | Median Earnings |
| Immigrants | Iran | 100.0 /100 | #8 | Exceptional $57,612 |
| Okinawans | 100.0 /100 | #9 | Exceptional $57,550 |
| Immigrants | South Central Asia | 100.0 /100 | #10 | Exceptional $57,114 |
| Immigrants | Israel | 100.0 /100 | #11 | Exceptional $57,034 |
| Immigrants | Ireland | 100.0 /100 | #12 | Exceptional $56,854 |
| Immigrants | China | 100.0 /100 | #13 | Exceptional $56,638 |
| Immigrants | Australia | 100.0 /100 | #14 | Exceptional $56,305 |
| Indians (Asian) | 100.0 /100 | #15 | Exceptional $56,253 |
| Immigrants | Eastern Asia | 100.0 /100 | #16 | Exceptional $56,183 |
| Eastern Europeans | 100.0 /100 | #17 | Exceptional $55,084 |
| Immigrants | Japan | 100.0 /100 | #18 | Exceptional $54,938 |
| Immigrants | Belgium | 100.0 /100 | #19 | Exceptional $54,679 |
| Cypriots | 100.0 /100 | #20 | Exceptional $54,589 |
| Burmese | 100.0 /100 | #21 | Exceptional $54,559 |
| Immigrants | Korea | 100.0 /100 | #22 | Exceptional $54,530 |