Slavic vs Chickasaw Wage/Income Gap
COMPARE
Slavic
Chickasaw
Wage/Income Gap
Wage/Income Gap Comparison
Slavs
Chickasaw
27.4%
WAGE/INCOME GAP
1.8/ 100
METRIC RATING
258th/ 347
METRIC RANK
27.2%
WAGE/INCOME GAP
3.5/ 100
METRIC RATING
244th/ 347
METRIC RANK
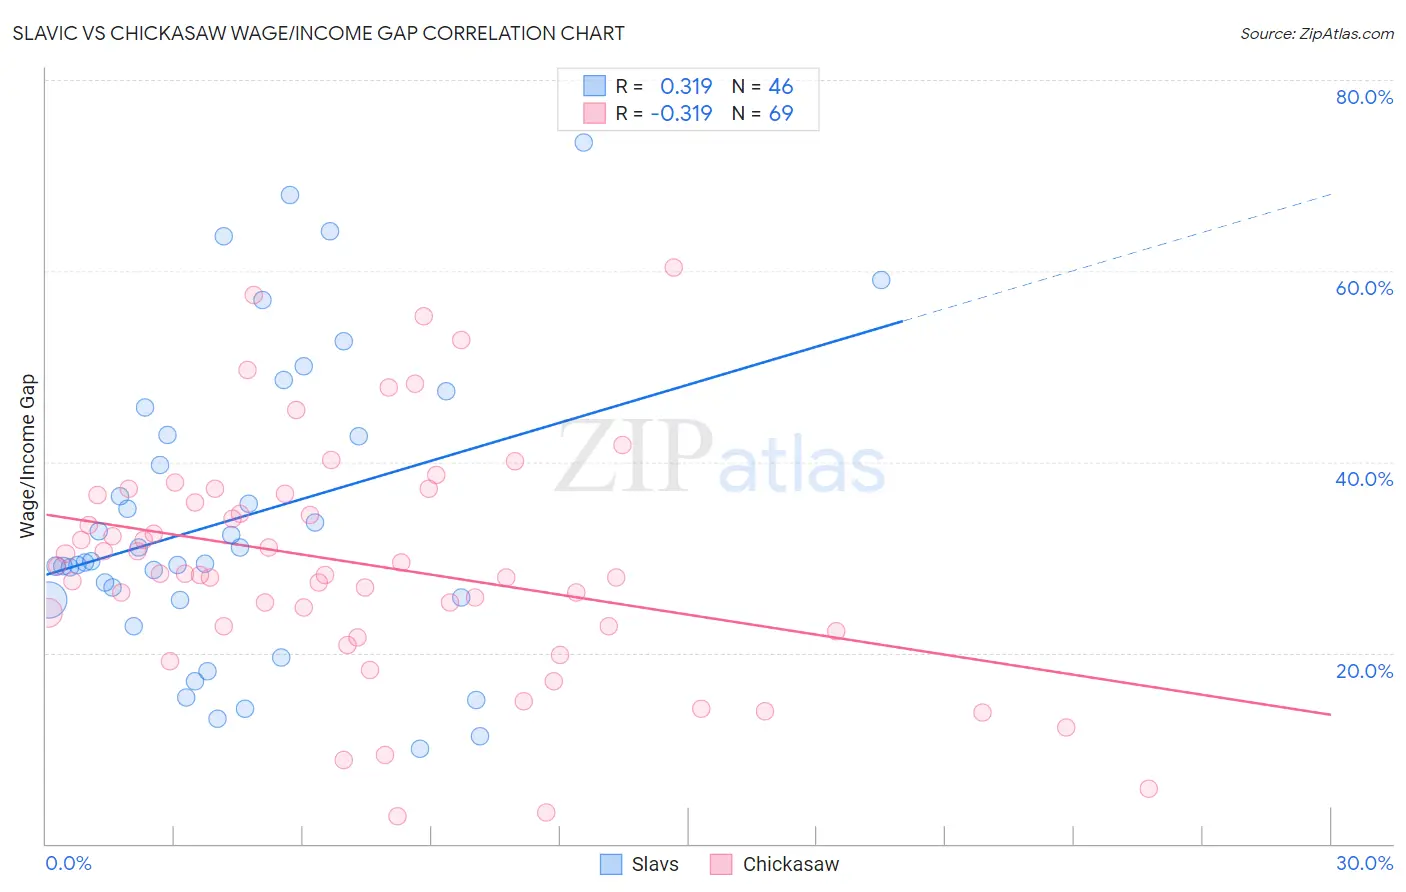
Slavic vs Chickasaw Wage/Income Gap Correlation Chart
The statistical analysis conducted on geographies consisting of 270,754,650 people shows a mild positive correlation between the proportion of Slavs and wage/income gap percentage in the United States with a correlation coefficient (R) of 0.319 and weighted average of 27.4%. Similarly, the statistical analysis conducted on geographies consisting of 147,661,645 people shows a mild negative correlation between the proportion of Chickasaw and wage/income gap percentage in the United States with a correlation coefficient (R) of -0.319 and weighted average of 27.2%, a difference of 1.0%.
Wage/Income Gap Correlation Summary
| Measurement | Slavic | Chickasaw |
| Minimum | 10.0% | 2.8% |
| Maximum | 73.5% | 60.4% |
| Range | 63.5% | 57.6% |
| Mean | 34.2% | 29.3% |
| Median | 29.5% | 28.3% |
| Interquartile 25% (IQ1) | 25.6% | 22.5% |
| Interquartile 75% (IQ3) | 42.9% | 36.6% |
| Interquartile Range (IQR) | 17.3% | 14.2% |
| Standard Deviation (Sample) | 15.7% | 12.2% |
| Standard Deviation (Population) | 15.5% | 12.2% |
Demographics Similar to Slavs and Chickasaw by Wage/Income Gap
In terms of wage/income gap, the demographic groups most similar to Slavs are Luxembourger (27.4%, a difference of 0.040%), Icelander (27.5%, a difference of 0.080%), Cherokee (27.4%, a difference of 0.090%), Tongan (27.5%, a difference of 0.090%), and Immigrants from France (27.4%, a difference of 0.19%). Similarly, the demographic groups most similar to Chickasaw are Immigrants from the Azores (27.2%, a difference of 0.020%), Spanish (27.1%, a difference of 0.070%), Immigrants from Sri Lanka (27.1%, a difference of 0.080%), Nonimmigrants (27.2%, a difference of 0.090%), and Creek (27.1%, a difference of 0.13%).
| Demographics | Rating | Rank | Wage/Income Gap |
| Creek | 3.8 /100 | #241 | Tragic 27.1% |
| Immigrants | Sri Lanka | 3.7 /100 | #242 | Tragic 27.1% |
| Spanish | 3.6 /100 | #243 | Tragic 27.1% |
| Chickasaw | 3.5 /100 | #244 | Tragic 27.2% |
| Immigrants | Azores | 3.5 /100 | #245 | Tragic 27.2% |
| Immigrants | Nonimmigrants | 3.3 /100 | #246 | Tragic 27.2% |
| Celtics | 2.8 /100 | #247 | Tragic 27.3% |
| Cypriots | 2.8 /100 | #248 | Tragic 27.3% |
| Carpatho Rusyns | 2.7 /100 | #249 | Tragic 27.3% |
| Immigrants | Czechoslovakia | 2.7 /100 | #250 | Tragic 27.3% |
| Immigrants | Norway | 2.5 /100 | #251 | Tragic 27.3% |
| Ukrainians | 2.4 /100 | #252 | Tragic 27.3% |
| Portuguese | 2.2 /100 | #253 | Tragic 27.4% |
| Israelis | 2.1 /100 | #254 | Tragic 27.4% |
| Immigrants | France | 2.1 /100 | #255 | Tragic 27.4% |
| Cherokee | 1.9 /100 | #256 | Tragic 27.4% |
| Luxembourgers | 1.9 /100 | #257 | Tragic 27.4% |
| Slavs | 1.8 /100 | #258 | Tragic 27.4% |
| Icelanders | 1.8 /100 | #259 | Tragic 27.5% |
| Tongans | 1.7 /100 | #260 | Tragic 27.5% |
| Immigrants | Germany | 1.5 /100 | #261 | Tragic 27.5% |