Immigrants from North America vs Celtic Wage/Income Gap
COMPARE
Immigrants from North America
Celtic
Wage/Income Gap
Wage/Income Gap Comparison
Immigrants from North America
Celtics
28.4%
WAGE/INCOME GAP
0.2/ 100
METRIC RATING
297th/ 347
METRIC RANK
27.3%
WAGE/INCOME GAP
2.8/ 100
METRIC RATING
247th/ 347
METRIC RANK
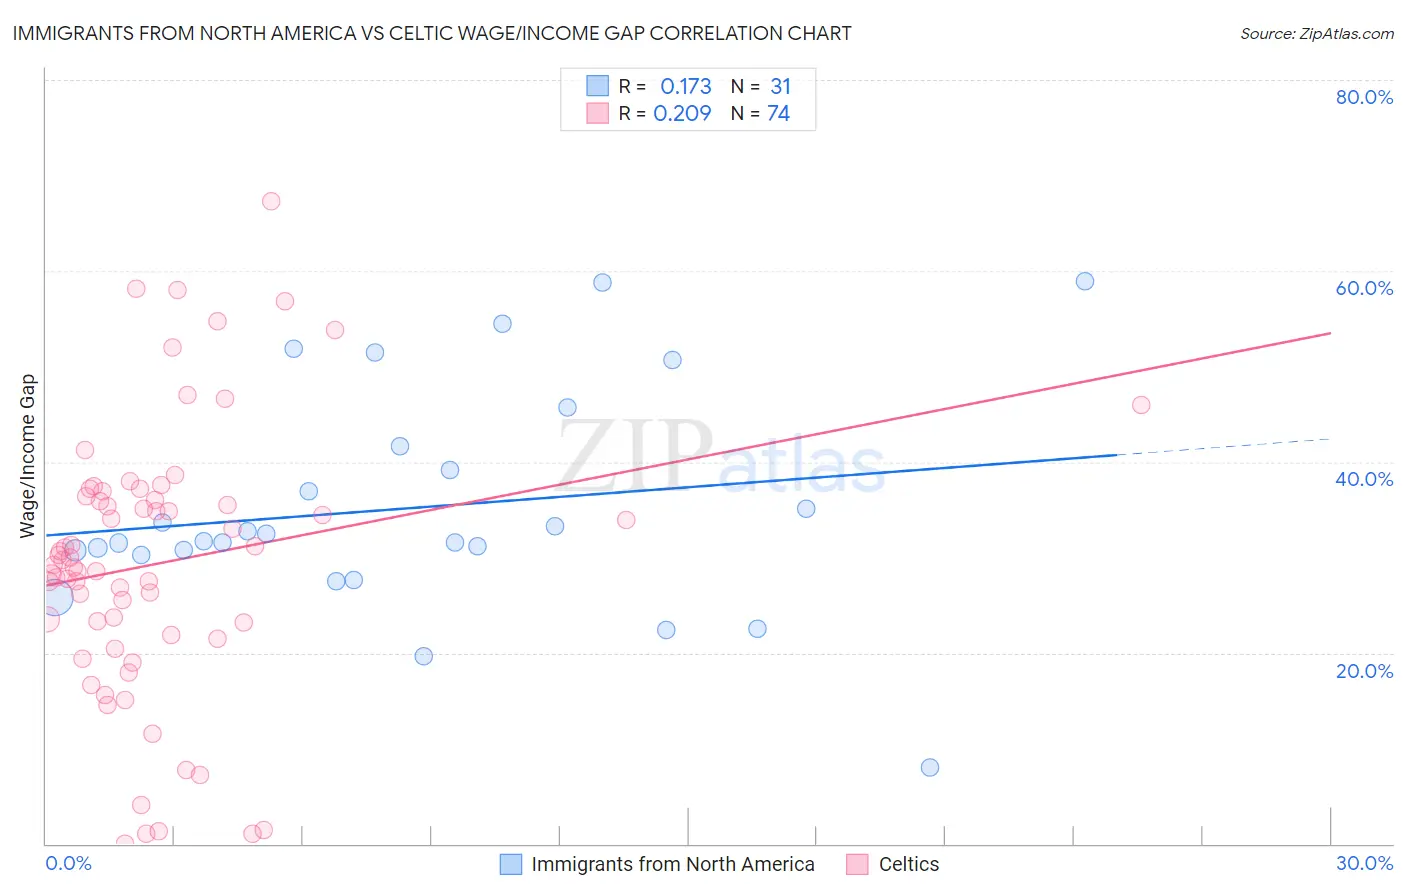
Immigrants from North America vs Celtic Wage/Income Gap Correlation Chart
The statistical analysis conducted on geographies consisting of 461,849,295 people shows a poor positive correlation between the proportion of Immigrants from North America and wage/income gap percentage in the United States with a correlation coefficient (R) of 0.173 and weighted average of 28.4%. Similarly, the statistical analysis conducted on geographies consisting of 168,805,315 people shows a weak positive correlation between the proportion of Celtics and wage/income gap percentage in the United States with a correlation coefficient (R) of 0.209 and weighted average of 27.3%, a difference of 4.2%.
Wage/Income Gap Correlation Summary
| Measurement | Immigrants from North America | Celtic |
| Minimum | 8.0% | 0.040% |
| Maximum | 58.9% | 67.3% |
| Range | 50.9% | 67.3% |
| Mean | 35.2% | 29.4% |
| Median | 31.8% | 29.5% |
| Interquartile 25% (IQ1) | 30.2% | 21.9% |
| Interquartile 75% (IQ3) | 41.7% | 36.4% |
| Interquartile Range (IQR) | 11.5% | 14.5% |
| Standard Deviation (Sample) | 11.7% | 14.3% |
| Standard Deviation (Population) | 11.5% | 14.2% |
Similar Demographics by Wage/Income Gap
Demographics Similar to Immigrants from North America by Wage/Income Gap
In terms of wage/income gap, the demographic groups most similar to Immigrants from North America are Austrian (28.4%, a difference of 0.0%), Immigrants from North Macedonia (28.4%, a difference of 0.050%), Immigrants from Northern Europe (28.5%, a difference of 0.17%), Immigrants from Canada (28.5%, a difference of 0.21%), and Scotch-Irish (28.5%, a difference of 0.24%).
| Demographics | Rating | Rank | Wage/Income Gap |
| Australians | 0.3 /100 | #290 | Tragic 28.2% |
| Czechoslovakians | 0.3 /100 | #291 | Tragic 28.2% |
| Immigrants | Australia | 0.3 /100 | #292 | Tragic 28.2% |
| Immigrants | Israel | 0.3 /100 | #293 | Tragic 28.2% |
| Greeks | 0.3 /100 | #294 | Tragic 28.2% |
| Slovenes | 0.3 /100 | #295 | Tragic 28.3% |
| Northern Europeans | 0.3 /100 | #296 | Tragic 28.3% |
| Immigrants | North America | 0.2 /100 | #297 | Tragic 28.4% |
| Austrians | 0.2 /100 | #298 | Tragic 28.4% |
| Immigrants | North Macedonia | 0.2 /100 | #299 | Tragic 28.4% |
| Immigrants | Northern Europe | 0.2 /100 | #300 | Tragic 28.5% |
| Immigrants | Canada | 0.2 /100 | #301 | Tragic 28.5% |
| Scotch-Irish | 0.2 /100 | #302 | Tragic 28.5% |
| Irish | 0.2 /100 | #303 | Tragic 28.5% |
| Immigrants | Netherlands | 0.2 /100 | #304 | Tragic 28.5% |
Demographics Similar to Celtics by Wage/Income Gap
In terms of wage/income gap, the demographic groups most similar to Celtics are Cypriot (27.3%, a difference of 0.010%), Carpatho Rusyn (27.3%, a difference of 0.020%), Immigrants from Czechoslovakia (27.3%, a difference of 0.030%), Immigrants from Norway (27.3%, a difference of 0.14%), and Ukrainian (27.3%, a difference of 0.20%).
| Demographics | Rating | Rank | Wage/Income Gap |
| Immigrants | Europe | 3.8 /100 | #240 | Tragic 27.1% |
| Creek | 3.8 /100 | #241 | Tragic 27.1% |
| Immigrants | Sri Lanka | 3.7 /100 | #242 | Tragic 27.1% |
| Spanish | 3.6 /100 | #243 | Tragic 27.1% |
| Chickasaw | 3.5 /100 | #244 | Tragic 27.2% |
| Immigrants | Azores | 3.5 /100 | #245 | Tragic 27.2% |
| Immigrants | Nonimmigrants | 3.3 /100 | #246 | Tragic 27.2% |
| Celtics | 2.8 /100 | #247 | Tragic 27.3% |
| Cypriots | 2.8 /100 | #248 | Tragic 27.3% |
| Carpatho Rusyns | 2.7 /100 | #249 | Tragic 27.3% |
| Immigrants | Czechoslovakia | 2.7 /100 | #250 | Tragic 27.3% |
| Immigrants | Norway | 2.5 /100 | #251 | Tragic 27.3% |
| Ukrainians | 2.4 /100 | #252 | Tragic 27.3% |
| Portuguese | 2.2 /100 | #253 | Tragic 27.4% |
| Israelis | 2.1 /100 | #254 | Tragic 27.4% |