Immigrants from Guyana vs Puget Sound Salish Median Earnings
COMPARE
Immigrants from Guyana
Puget Sound Salish
Median Earnings
Median Earnings Comparison
Immigrants from Guyana
Puget Sound Salish
$45,204
MEDIAN EARNINGS
15.1/ 100
METRIC RATING
221st/ 347
METRIC RANK
$46,333
MEDIAN EARNINGS
46.5/ 100
METRIC RATING
180th/ 347
METRIC RANK
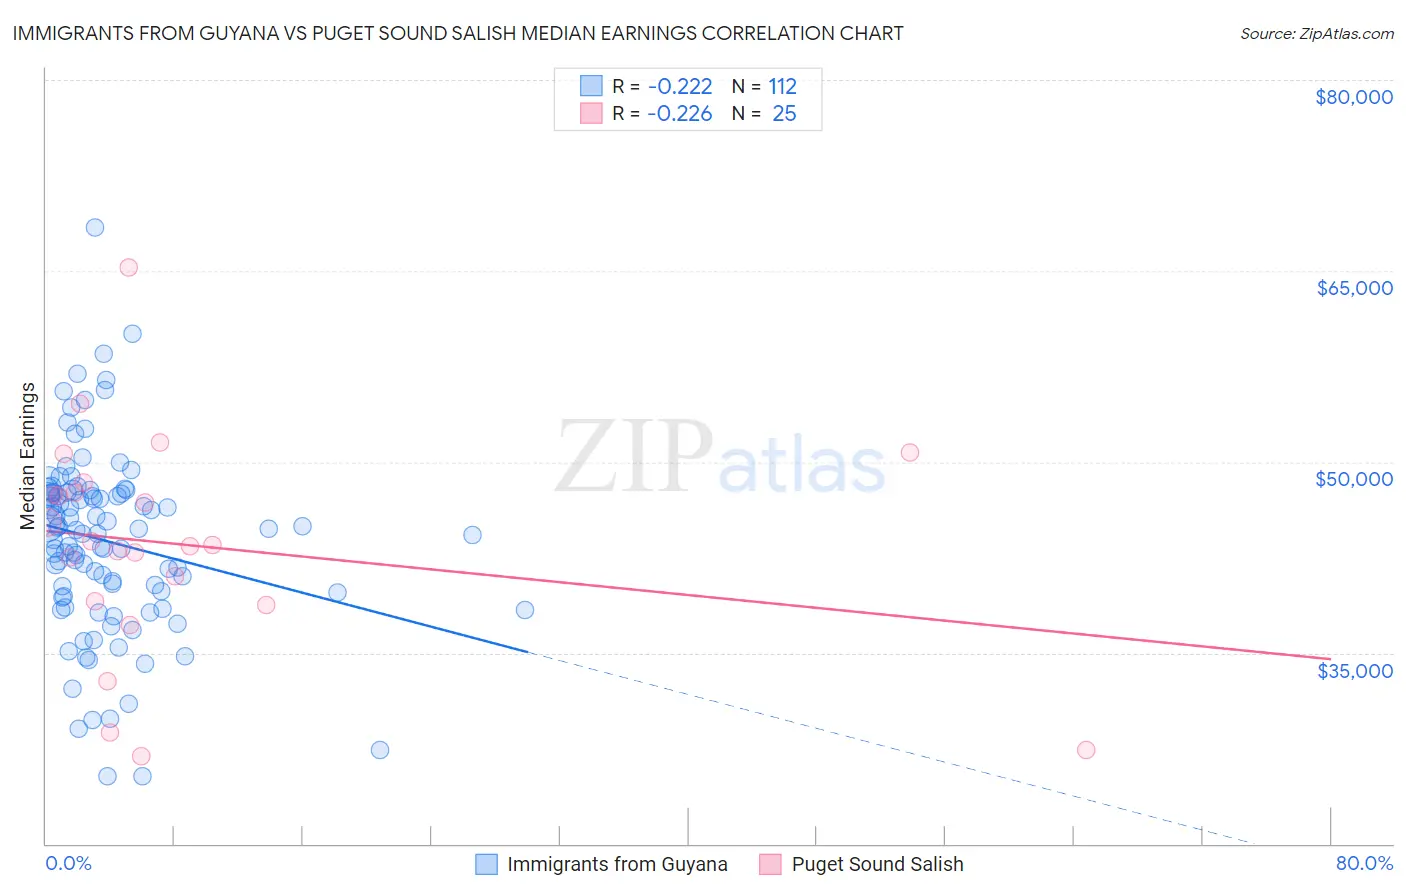
Immigrants from Guyana vs Puget Sound Salish Median Earnings Correlation Chart
The statistical analysis conducted on geographies consisting of 183,726,948 people shows a weak negative correlation between the proportion of Immigrants from Guyana and median earnings in the United States with a correlation coefficient (R) of -0.222 and weighted average of $45,204. Similarly, the statistical analysis conducted on geographies consisting of 46,155,746 people shows a weak negative correlation between the proportion of Puget Sound Salish and median earnings in the United States with a correlation coefficient (R) of -0.226 and weighted average of $46,333, a difference of 2.5%.
Median Earnings Correlation Summary
| Measurement | Immigrants from Guyana | Puget Sound Salish |
| Minimum | $25,266 | $26,875 |
| Maximum | $68,439 | $65,298 |
| Range | $43,174 | $38,423 |
| Mean | $43,730 | $43,450 |
| Median | $44,540 | $43,514 |
| Interquartile 25% (IQ1) | $39,599 | $38,912 |
| Interquartile 75% (IQ3) | $47,563 | $47,991 |
| Interquartile Range (IQR) | $7,964 | $9,079 |
| Standard Deviation (Sample) | $7,179 | $8,689 |
| Standard Deviation (Population) | $7,147 | $8,513 |
Similar Demographics by Median Earnings
Demographics Similar to Immigrants from Guyana by Median Earnings
In terms of median earnings, the demographic groups most similar to Immigrants from Guyana are Immigrants from Panama ($45,198, a difference of 0.010%), Ecuadorian ($45,214, a difference of 0.020%), White/Caucasian ($45,197, a difference of 0.020%), West Indian ($45,132, a difference of 0.16%), and Immigrants from Cambodia ($45,090, a difference of 0.25%).
| Demographics | Rating | Rank | Median Earnings |
| Nigerians | 22.0 /100 | #214 | Fair $45,532 |
| Immigrants | Bangladesh | 22.0 /100 | #215 | Fair $45,532 |
| Guyanese | 20.6 /100 | #216 | Fair $45,470 |
| Tlingit-Haida | 20.5 /100 | #217 | Fair $45,468 |
| Spanish | 19.7 /100 | #218 | Poor $45,432 |
| Dutch | 18.4 /100 | #219 | Poor $45,370 |
| Ecuadorians | 15.3 /100 | #220 | Poor $45,214 |
| Immigrants | Guyana | 15.1 /100 | #221 | Poor $45,204 |
| Immigrants | Panama | 15.0 /100 | #222 | Poor $45,198 |
| Whites/Caucasians | 15.0 /100 | #223 | Poor $45,197 |
| West Indians | 13.9 /100 | #224 | Poor $45,132 |
| Immigrants | Cambodia | 13.2 /100 | #225 | Poor $45,090 |
| Immigrants | Nigeria | 12.2 /100 | #226 | Poor $45,030 |
| Native Hawaiians | 12.2 /100 | #227 | Poor $45,027 |
| Immigrants | Iraq | 11.6 /100 | #228 | Poor $44,988 |
Demographics Similar to Puget Sound Salish by Median Earnings
In terms of median earnings, the demographic groups most similar to Puget Sound Salish are English ($46,334, a difference of 0.0%), Immigrants from Cameroon ($46,329, a difference of 0.010%), Colombian ($46,349, a difference of 0.040%), Swiss ($46,315, a difference of 0.040%), and French ($46,296, a difference of 0.080%).
| Demographics | Rating | Rank | Median Earnings |
| Ghanaians | 50.3 /100 | #173 | Average $46,440 |
| Scandinavians | 50.0 /100 | #174 | Average $46,433 |
| Basques | 48.8 /100 | #175 | Average $46,399 |
| Danes | 48.6 /100 | #176 | Average $46,392 |
| Belgians | 48.0 /100 | #177 | Average $46,375 |
| Colombians | 47.1 /100 | #178 | Average $46,349 |
| English | 46.5 /100 | #179 | Average $46,334 |
| Puget Sound Salish | 46.5 /100 | #180 | Average $46,333 |
| Immigrants | Cameroon | 46.4 /100 | #181 | Average $46,329 |
| Swiss | 45.9 /100 | #182 | Average $46,315 |
| French | 45.2 /100 | #183 | Average $46,296 |
| Immigrants | Kenya | 42.4 /100 | #184 | Average $46,214 |
| Uruguayans | 41.6 /100 | #185 | Average $46,190 |
| Vietnamese | 40.9 /100 | #186 | Average $46,172 |
| Iraqis | 39.9 /100 | #187 | Fair $46,140 |