Filipino vs Puget Sound Salish Median Earnings
COMPARE
Filipino
Puget Sound Salish
Median Earnings
Median Earnings Comparison
Filipinos
Puget Sound Salish
$61,197
MEDIAN EARNINGS
100.0/ 100
METRIC RATING
1st/ 347
METRIC RANK
$46,333
MEDIAN EARNINGS
46.5/ 100
METRIC RATING
180th/ 347
METRIC RANK
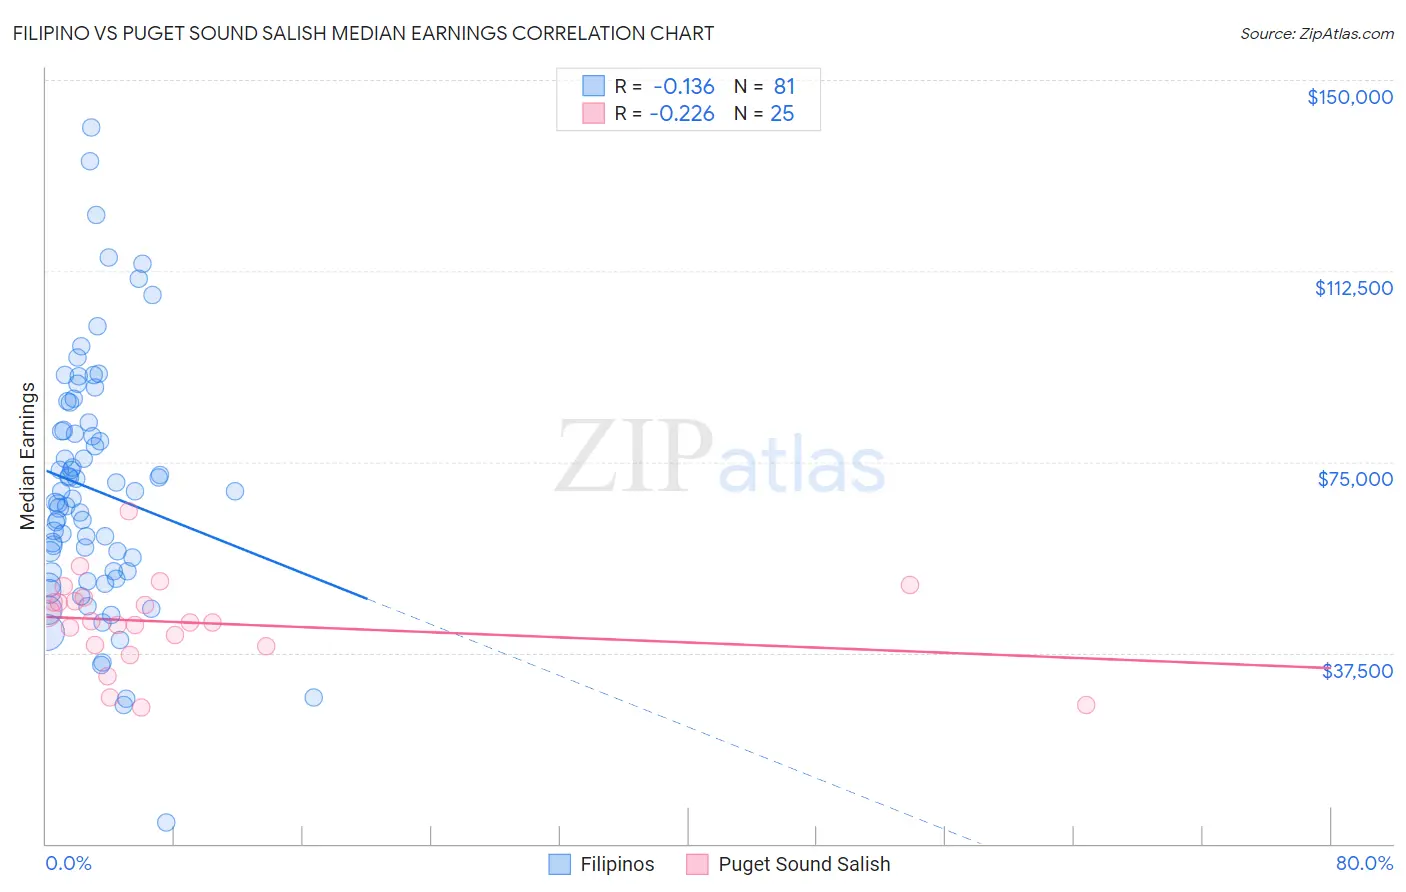
Filipino vs Puget Sound Salish Median Earnings Correlation Chart
The statistical analysis conducted on geographies consisting of 254,346,955 people shows a poor negative correlation between the proportion of Filipinos and median earnings in the United States with a correlation coefficient (R) of -0.136 and weighted average of $61,197. Similarly, the statistical analysis conducted on geographies consisting of 46,155,746 people shows a weak negative correlation between the proportion of Puget Sound Salish and median earnings in the United States with a correlation coefficient (R) of -0.226 and weighted average of $46,333, a difference of 32.1%.
Median Earnings Correlation Summary
| Measurement | Filipino | Puget Sound Salish |
| Minimum | $4,235 | $26,875 |
| Maximum | $140,756 | $65,298 |
| Range | $136,521 | $38,423 |
| Mean | $69,566 | $43,450 |
| Median | $67,852 | $43,514 |
| Interquartile 25% (IQ1) | $53,487 | $38,912 |
| Interquartile 75% (IQ3) | $81,976 | $47,991 |
| Interquartile Range (IQR) | $28,490 | $9,079 |
| Standard Deviation (Sample) | $24,296 | $8,689 |
| Standard Deviation (Population) | $24,146 | $8,513 |
Similar Demographics by Median Earnings
Demographics Similar to Filipinos by Median Earnings
In terms of median earnings, the demographic groups most similar to Filipinos are Immigrants from Taiwan ($61,151, a difference of 0.080%), Immigrants from India ($60,648, a difference of 0.91%), Immigrants from Hong Kong ($59,433, a difference of 3.0%), Thai ($59,237, a difference of 3.3%), and Immigrants from Singapore ($59,038, a difference of 3.7%).
| Demographics | Rating | Rank | Median Earnings |
| Filipinos | 100.0 /100 | #1 | Exceptional $61,197 |
| Immigrants | Taiwan | 100.0 /100 | #2 | Exceptional $61,151 |
| Immigrants | India | 100.0 /100 | #3 | Exceptional $60,648 |
| Immigrants | Hong Kong | 100.0 /100 | #4 | Exceptional $59,433 |
| Thais | 100.0 /100 | #5 | Exceptional $59,237 |
| Immigrants | Singapore | 100.0 /100 | #6 | Exceptional $59,038 |
| Iranians | 100.0 /100 | #7 | Exceptional $58,474 |
| Immigrants | Iran | 100.0 /100 | #8 | Exceptional $57,612 |
| Okinawans | 100.0 /100 | #9 | Exceptional $57,550 |
| Immigrants | South Central Asia | 100.0 /100 | #10 | Exceptional $57,114 |
| Immigrants | Israel | 100.0 /100 | #11 | Exceptional $57,034 |
| Immigrants | Ireland | 100.0 /100 | #12 | Exceptional $56,854 |
| Immigrants | China | 100.0 /100 | #13 | Exceptional $56,638 |
| Immigrants | Australia | 100.0 /100 | #14 | Exceptional $56,305 |
| Indians (Asian) | 100.0 /100 | #15 | Exceptional $56,253 |
Demographics Similar to Puget Sound Salish by Median Earnings
In terms of median earnings, the demographic groups most similar to Puget Sound Salish are English ($46,334, a difference of 0.0%), Immigrants from Cameroon ($46,329, a difference of 0.010%), Colombian ($46,349, a difference of 0.040%), Swiss ($46,315, a difference of 0.040%), and French ($46,296, a difference of 0.080%).
| Demographics | Rating | Rank | Median Earnings |
| Ghanaians | 50.3 /100 | #173 | Average $46,440 |
| Scandinavians | 50.0 /100 | #174 | Average $46,433 |
| Basques | 48.8 /100 | #175 | Average $46,399 |
| Danes | 48.6 /100 | #176 | Average $46,392 |
| Belgians | 48.0 /100 | #177 | Average $46,375 |
| Colombians | 47.1 /100 | #178 | Average $46,349 |
| English | 46.5 /100 | #179 | Average $46,334 |
| Puget Sound Salish | 46.5 /100 | #180 | Average $46,333 |
| Immigrants | Cameroon | 46.4 /100 | #181 | Average $46,329 |
| Swiss | 45.9 /100 | #182 | Average $46,315 |
| French | 45.2 /100 | #183 | Average $46,296 |
| Immigrants | Kenya | 42.4 /100 | #184 | Average $46,214 |
| Uruguayans | 41.6 /100 | #185 | Average $46,190 |
| Vietnamese | 40.9 /100 | #186 | Average $46,172 |
| Iraqis | 39.9 /100 | #187 | Fair $46,140 |