Immigrants from Guyana vs Puget Sound Salish Associate's Degree
COMPARE
Immigrants from Guyana
Puget Sound Salish
Associate's Degree
Associate's Degree Comparison
Immigrants from Guyana
Puget Sound Salish
41.8%
ASSOCIATE'S DEGREE
0.5/ 100
METRIC RATING
255th/ 347
METRIC RANK
40.5%
ASSOCIATE'S DEGREE
0.1/ 100
METRIC RATING
273rd/ 347
METRIC RANK
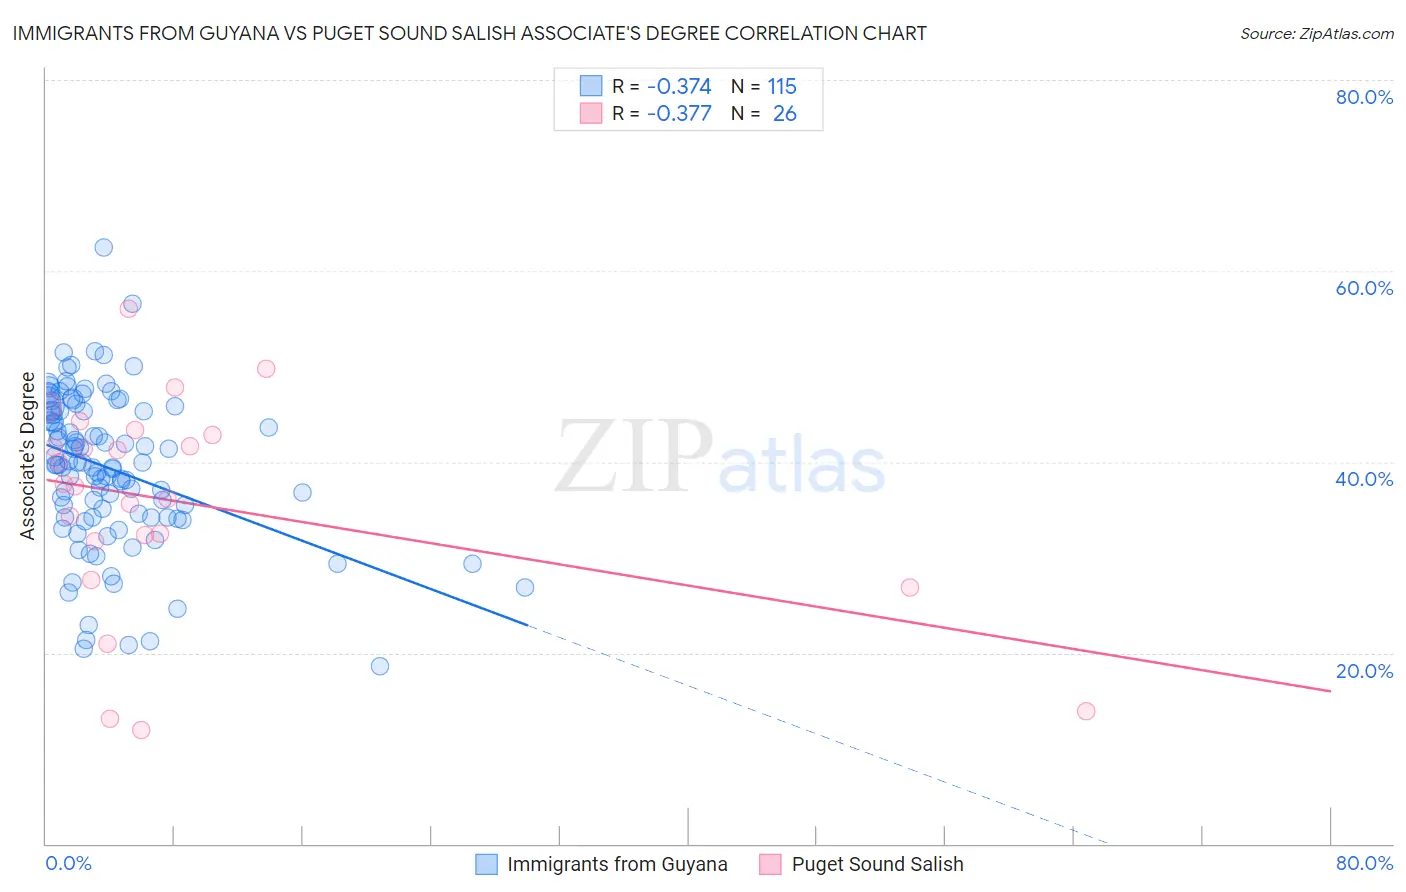
Immigrants from Guyana vs Puget Sound Salish Associate's Degree Correlation Chart
The statistical analysis conducted on geographies consisting of 183,738,689 people shows a mild negative correlation between the proportion of Immigrants from Guyana and percentage of population with at least associate's degree education in the United States with a correlation coefficient (R) of -0.374 and weighted average of 41.8%. Similarly, the statistical analysis conducted on geographies consisting of 46,155,865 people shows a mild negative correlation between the proportion of Puget Sound Salish and percentage of population with at least associate's degree education in the United States with a correlation coefficient (R) of -0.377 and weighted average of 40.5%, a difference of 3.3%.
Associate's Degree Correlation Summary
| Measurement | Immigrants from Guyana | Puget Sound Salish |
| Minimum | 18.6% | 11.9% |
| Maximum | 62.4% | 56.0% |
| Range | 43.8% | 44.1% |
| Mean | 39.3% | 35.7% |
| Median | 39.7% | 37.6% |
| Interquartile 25% (IQ1) | 34.1% | 31.6% |
| Interquartile 75% (IQ3) | 45.3% | 42.9% |
| Interquartile Range (IQR) | 11.2% | 11.2% |
| Standard Deviation (Sample) | 8.0% | 11.2% |
| Standard Deviation (Population) | 8.0% | 11.0% |
Demographics Similar to Immigrants from Guyana and Puget Sound Salish by Associate's Degree
In terms of associate's degree, the demographic groups most similar to Immigrants from Guyana are Cuban (41.9%, a difference of 0.090%), Immigrants from Congo (41.8%, a difference of 0.12%), Spanish American (41.8%, a difference of 0.18%), Japanese (41.7%, a difference of 0.40%), and Malaysian (41.6%, a difference of 0.50%). Similarly, the demographic groups most similar to Puget Sound Salish are Immigrants from Dominica (40.5%, a difference of 0.14%), Belizean (40.6%, a difference of 0.29%), Immigrants from Laos (40.7%, a difference of 0.36%), Chippewa (40.7%, a difference of 0.55%), and American (40.8%, a difference of 0.59%).
| Demographics | Rating | Rank | Associate's Degree |
| Cubans | 0.6 /100 | #254 | Tragic 41.9% |
| Immigrants | Guyana | 0.5 /100 | #255 | Tragic 41.8% |
| Immigrants | Congo | 0.5 /100 | #256 | Tragic 41.8% |
| Spanish Americans | 0.5 /100 | #257 | Tragic 41.8% |
| Japanese | 0.5 /100 | #258 | Tragic 41.7% |
| Malaysians | 0.4 /100 | #259 | Tragic 41.6% |
| Marshallese | 0.4 /100 | #260 | Tragic 41.6% |
| Nicaraguans | 0.4 /100 | #261 | Tragic 41.5% |
| Bahamians | 0.4 /100 | #262 | Tragic 41.5% |
| Immigrants | Jamaica | 0.3 /100 | #263 | Tragic 41.5% |
| Osage | 0.3 /100 | #264 | Tragic 41.5% |
| Africans | 0.2 /100 | #265 | Tragic 41.1% |
| Samoans | 0.2 /100 | #266 | Tragic 41.1% |
| Hawaiians | 0.2 /100 | #267 | Tragic 40.9% |
| Central American Indians | 0.2 /100 | #268 | Tragic 40.8% |
| Americans | 0.2 /100 | #269 | Tragic 40.8% |
| Chippewa | 0.2 /100 | #270 | Tragic 40.7% |
| Immigrants | Laos | 0.1 /100 | #271 | Tragic 40.7% |
| Belizeans | 0.1 /100 | #272 | Tragic 40.6% |
| Puget Sound Salish | 0.1 /100 | #273 | Tragic 40.5% |
| Immigrants | Dominica | 0.1 /100 | #274 | Tragic 40.5% |