French vs Puget Sound Salish Median Earnings
COMPARE
French
Puget Sound Salish
Median Earnings
Median Earnings Comparison
French
Puget Sound Salish
$46,296
MEDIAN EARNINGS
45.2/ 100
METRIC RATING
183rd/ 347
METRIC RANK
$46,333
MEDIAN EARNINGS
46.5/ 100
METRIC RATING
180th/ 347
METRIC RANK
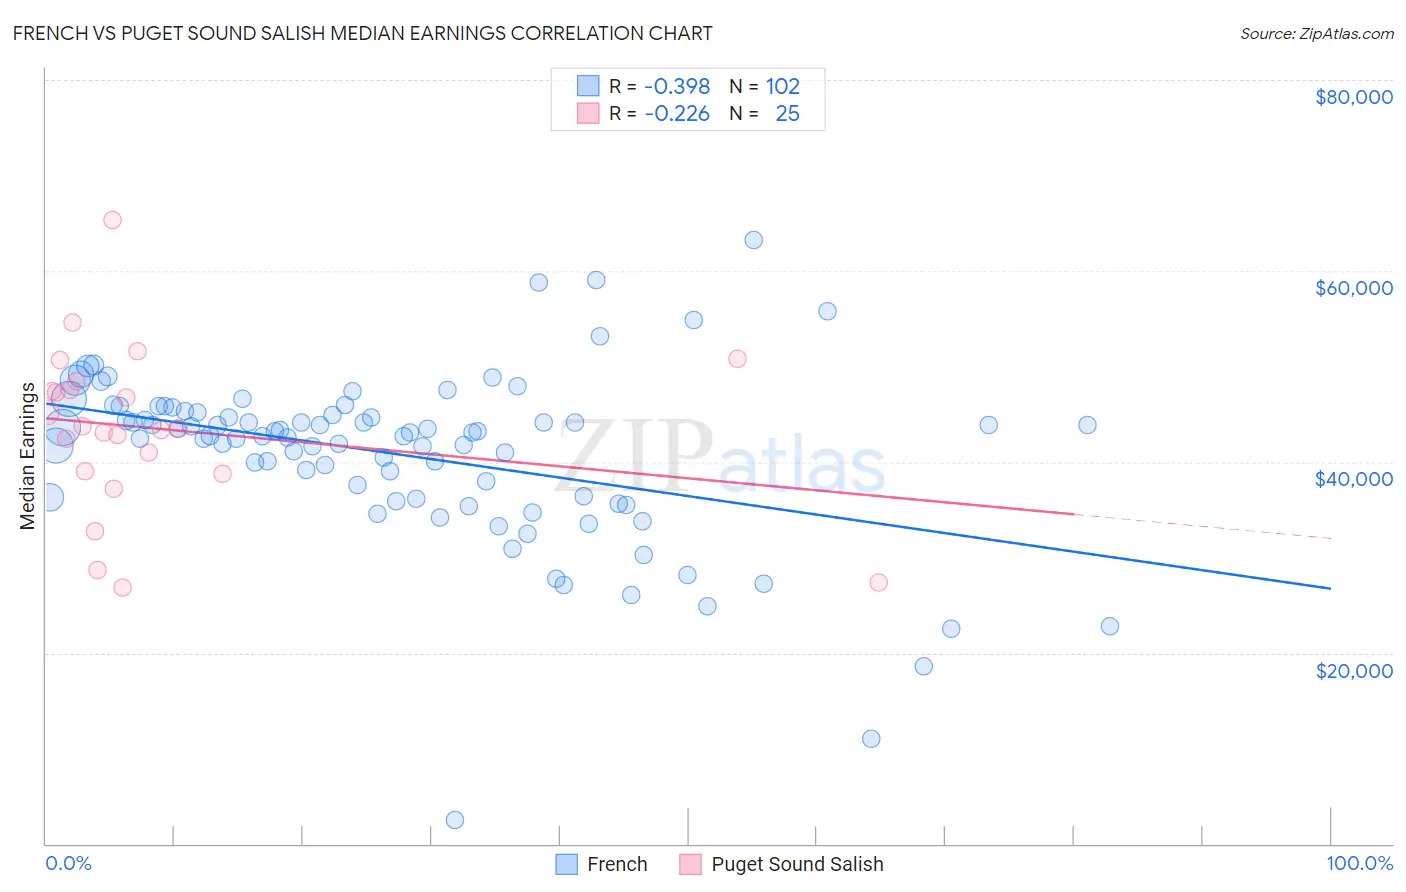
French vs Puget Sound Salish Median Earnings Correlation Chart
The statistical analysis conducted on geographies consisting of 572,035,046 people shows a mild negative correlation between the proportion of French and median earnings in the United States with a correlation coefficient (R) of -0.398 and weighted average of $46,296. Similarly, the statistical analysis conducted on geographies consisting of 46,155,746 people shows a weak negative correlation between the proportion of Puget Sound Salish and median earnings in the United States with a correlation coefficient (R) of -0.226 and weighted average of $46,333, a difference of 0.080%.
Median Earnings Correlation Summary
| Measurement | French | Puget Sound Salish |
| Minimum | $2,499 | $26,875 |
| Maximum | $63,271 | $65,298 |
| Range | $60,772 | $38,423 |
| Mean | $40,779 | $43,450 |
| Median | $42,886 | $43,514 |
| Interquartile 25% (IQ1) | $36,330 | $38,912 |
| Interquartile 75% (IQ3) | $45,125 | $47,991 |
| Interquartile Range (IQR) | $8,794 | $9,079 |
| Standard Deviation (Sample) | $9,085 | $8,689 |
| Standard Deviation (Population) | $9,040 | $8,513 |
Demographics Similar to French and Puget Sound Salish by Median Earnings
In terms of median earnings, the demographic groups most similar to French are Swiss ($46,315, a difference of 0.040%), Immigrants from Cameroon ($46,329, a difference of 0.070%), English ($46,334, a difference of 0.080%), Colombian ($46,349, a difference of 0.12%), and Belgian ($46,375, a difference of 0.17%). Similarly, the demographic groups most similar to Puget Sound Salish are English ($46,334, a difference of 0.0%), Immigrants from Cameroon ($46,329, a difference of 0.010%), Colombian ($46,349, a difference of 0.040%), Swiss ($46,315, a difference of 0.040%), and Belgian ($46,375, a difference of 0.090%).
| Demographics | Rating | Rank | Median Earnings |
| Scottish | 51.1 /100 | #171 | Average $46,463 |
| Kenyans | 51.0 /100 | #172 | Average $46,462 |
| Ghanaians | 50.3 /100 | #173 | Average $46,440 |
| Scandinavians | 50.0 /100 | #174 | Average $46,433 |
| Basques | 48.8 /100 | #175 | Average $46,399 |
| Danes | 48.6 /100 | #176 | Average $46,392 |
| Belgians | 48.0 /100 | #177 | Average $46,375 |
| Colombians | 47.1 /100 | #178 | Average $46,349 |
| English | 46.5 /100 | #179 | Average $46,334 |
| Puget Sound Salish | 46.5 /100 | #180 | Average $46,333 |
| Immigrants | Cameroon | 46.4 /100 | #181 | Average $46,329 |
| Swiss | 45.9 /100 | #182 | Average $46,315 |
| French | 45.2 /100 | #183 | Average $46,296 |
| Immigrants | Kenya | 42.4 /100 | #184 | Average $46,214 |
| Uruguayans | 41.6 /100 | #185 | Average $46,190 |
| Vietnamese | 40.9 /100 | #186 | Average $46,172 |
| Iraqis | 39.9 /100 | #187 | Fair $46,140 |
| Immigrants | Armenia | 38.3 /100 | #188 | Fair $46,094 |
| Spaniards | 37.2 /100 | #189 | Fair $46,059 |
| French Canadians | 36.1 /100 | #190 | Fair $46,026 |
| Finns | 33.4 /100 | #191 | Fair $45,940 |