Immigrants from Guyana vs European Median Earnings
COMPARE
Immigrants from Guyana
European
Median Earnings
Median Earnings Comparison
Immigrants from Guyana
Europeans
$45,204
MEDIAN EARNINGS
15.1/ 100
METRIC RATING
221st/ 347
METRIC RANK
$47,915
MEDIAN EARNINGS
88.9/ 100
METRIC RATING
138th/ 347
METRIC RANK
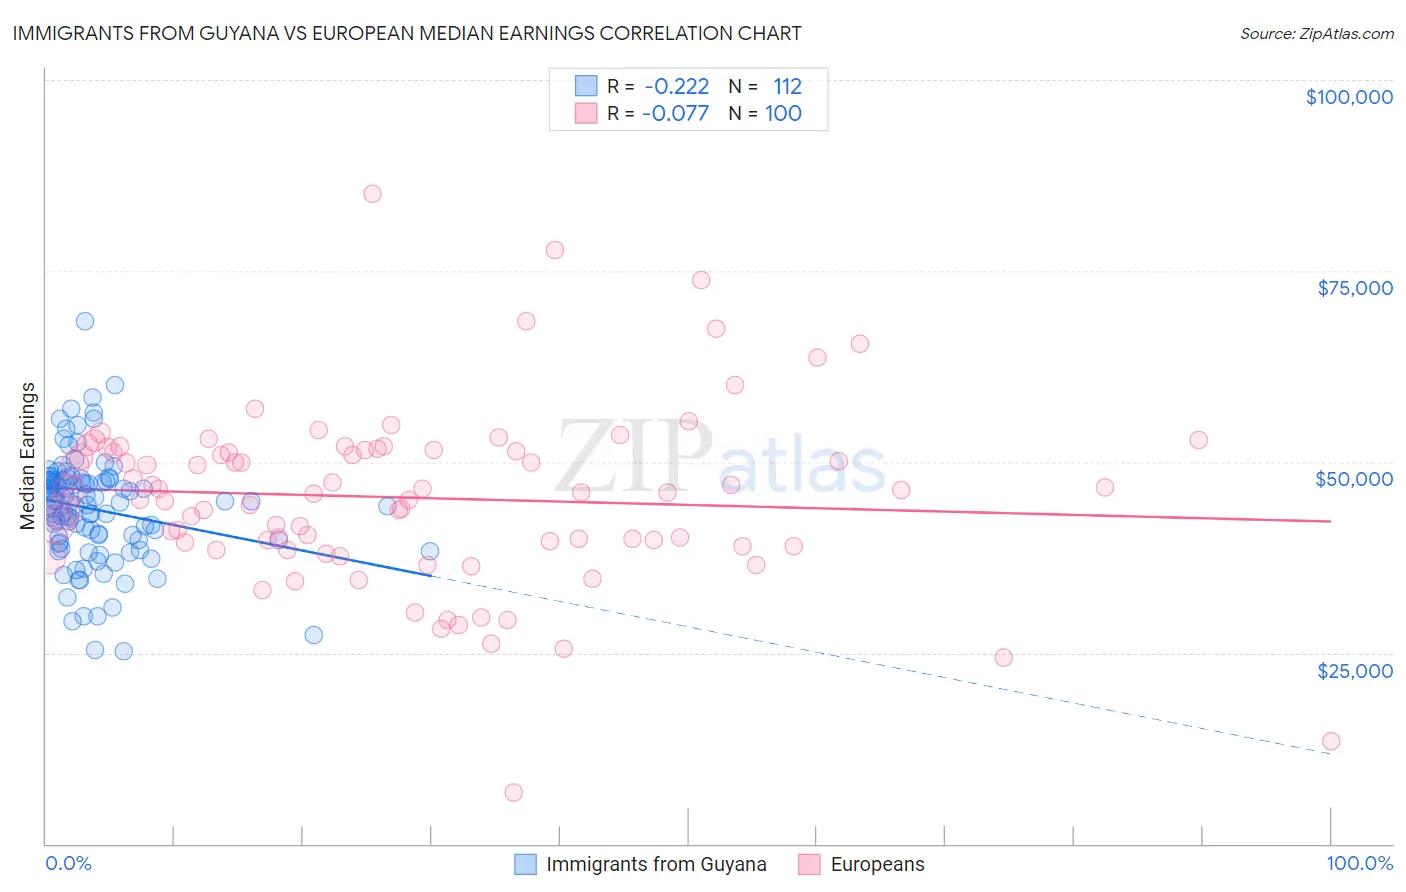
Immigrants from Guyana vs European Median Earnings Correlation Chart
The statistical analysis conducted on geographies consisting of 183,726,948 people shows a weak negative correlation between the proportion of Immigrants from Guyana and median earnings in the United States with a correlation coefficient (R) of -0.222 and weighted average of $45,204. Similarly, the statistical analysis conducted on geographies consisting of 561,558,991 people shows a slight negative correlation between the proportion of Europeans and median earnings in the United States with a correlation coefficient (R) of -0.077 and weighted average of $47,915, a difference of 6.0%.
Median Earnings Correlation Summary
| Measurement | Immigrants from Guyana | European |
| Minimum | $25,266 | $6,651 |
| Maximum | $68,439 | $85,181 |
| Range | $43,174 | $78,530 |
| Mean | $43,730 | $45,294 |
| Median | $44,540 | $45,994 |
| Interquartile 25% (IQ1) | $39,599 | $39,170 |
| Interquartile 75% (IQ3) | $47,563 | $51,535 |
| Interquartile Range (IQR) | $7,964 | $12,364 |
| Standard Deviation (Sample) | $7,179 | $11,738 |
| Standard Deviation (Population) | $7,147 | $11,679 |
Similar Demographics by Median Earnings
Demographics Similar to Immigrants from Guyana by Median Earnings
In terms of median earnings, the demographic groups most similar to Immigrants from Guyana are Immigrants from Panama ($45,198, a difference of 0.010%), Ecuadorian ($45,214, a difference of 0.020%), White/Caucasian ($45,197, a difference of 0.020%), West Indian ($45,132, a difference of 0.16%), and Immigrants from Cambodia ($45,090, a difference of 0.25%).
| Demographics | Rating | Rank | Median Earnings |
| Nigerians | 22.0 /100 | #214 | Fair $45,532 |
| Immigrants | Bangladesh | 22.0 /100 | #215 | Fair $45,532 |
| Guyanese | 20.6 /100 | #216 | Fair $45,470 |
| Tlingit-Haida | 20.5 /100 | #217 | Fair $45,468 |
| Spanish | 19.7 /100 | #218 | Poor $45,432 |
| Dutch | 18.4 /100 | #219 | Poor $45,370 |
| Ecuadorians | 15.3 /100 | #220 | Poor $45,214 |
| Immigrants | Guyana | 15.1 /100 | #221 | Poor $45,204 |
| Immigrants | Panama | 15.0 /100 | #222 | Poor $45,198 |
| Whites/Caucasians | 15.0 /100 | #223 | Poor $45,197 |
| West Indians | 13.9 /100 | #224 | Poor $45,132 |
| Immigrants | Cambodia | 13.2 /100 | #225 | Poor $45,090 |
| Immigrants | Nigeria | 12.2 /100 | #226 | Poor $45,030 |
| Native Hawaiians | 12.2 /100 | #227 | Poor $45,027 |
| Immigrants | Iraq | 11.6 /100 | #228 | Poor $44,988 |
Demographics Similar to Europeans by Median Earnings
In terms of median earnings, the demographic groups most similar to Europeans are Canadian ($47,911, a difference of 0.010%), Immigrants from Nepal ($47,925, a difference of 0.020%), Taiwanese ($47,902, a difference of 0.030%), Immigrants from Sierra Leone ($47,875, a difference of 0.080%), and Ugandan ($47,854, a difference of 0.13%).
| Demographics | Rating | Rank | Median Earnings |
| Lebanese | 92.5 /100 | #131 | Exceptional $48,226 |
| British | 92.2 /100 | #132 | Exceptional $48,189 |
| Immigrants | Uganda | 90.5 /100 | #133 | Exceptional $48,041 |
| Sri Lankans | 90.5 /100 | #134 | Exceptional $48,040 |
| Portuguese | 90.4 /100 | #135 | Exceptional $48,032 |
| Slovenes | 90.0 /100 | #136 | Excellent $47,995 |
| Immigrants | Nepal | 89.0 /100 | #137 | Excellent $47,925 |
| Europeans | 88.9 /100 | #138 | Excellent $47,915 |
| Canadians | 88.8 /100 | #139 | Excellent $47,911 |
| Taiwanese | 88.7 /100 | #140 | Excellent $47,902 |
| Immigrants | Sierra Leone | 88.3 /100 | #141 | Excellent $47,875 |
| Ugandans | 88.0 /100 | #142 | Excellent $47,854 |
| Swedes | 88.0 /100 | #143 | Excellent $47,851 |
| Hungarians | 87.1 /100 | #144 | Excellent $47,795 |
| Immigrants | Saudi Arabia | 85.6 /100 | #145 | Excellent $47,704 |