Immigrants from Guyana vs Ecuadorian Median Earnings
COMPARE
Immigrants from Guyana
Ecuadorian
Median Earnings
Median Earnings Comparison
Immigrants from Guyana
Ecuadorians
$45,204
MEDIAN EARNINGS
15.1/ 100
METRIC RATING
221st/ 347
METRIC RANK
$45,214
MEDIAN EARNINGS
15.3/ 100
METRIC RATING
220th/ 347
METRIC RANK
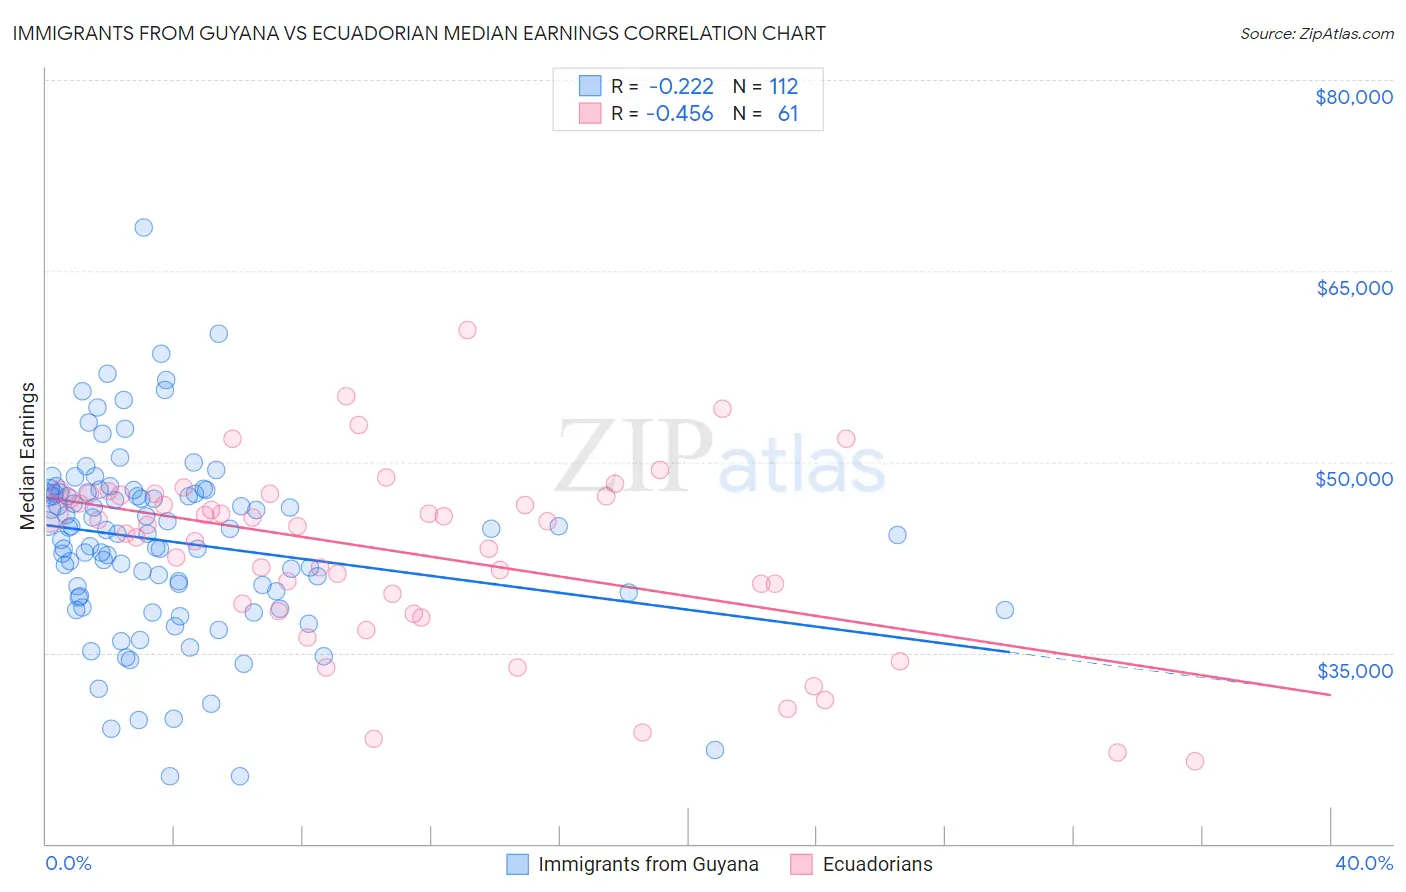
Immigrants from Guyana vs Ecuadorian Median Earnings Correlation Chart
The statistical analysis conducted on geographies consisting of 183,726,948 people shows a weak negative correlation between the proportion of Immigrants from Guyana and median earnings in the United States with a correlation coefficient (R) of -0.222 and weighted average of $45,204. Similarly, the statistical analysis conducted on geographies consisting of 317,848,977 people shows a moderate negative correlation between the proportion of Ecuadorians and median earnings in the United States with a correlation coefficient (R) of -0.456 and weighted average of $45,214, a difference of 0.020%.
Median Earnings Correlation Summary
| Measurement | Immigrants from Guyana | Ecuadorian |
| Minimum | $25,266 | $26,500 |
| Maximum | $68,439 | $60,377 |
| Range | $43,174 | $33,877 |
| Mean | $43,730 | $42,954 |
| Median | $44,540 | $45,047 |
| Interquartile 25% (IQ1) | $39,599 | $38,574 |
| Interquartile 75% (IQ3) | $47,563 | $47,434 |
| Interquartile Range (IQR) | $7,964 | $8,860 |
| Standard Deviation (Sample) | $7,179 | $7,114 |
| Standard Deviation (Population) | $7,147 | $7,055 |
Demographics Similar to Immigrants from Guyana and Ecuadorians by Median Earnings
In terms of median earnings, the demographic groups most similar to Immigrants from Guyana are Immigrants from Panama ($45,198, a difference of 0.010%), White/Caucasian ($45,197, a difference of 0.020%), West Indian ($45,132, a difference of 0.16%), Immigrants from Cambodia ($45,090, a difference of 0.25%), and Dutch ($45,370, a difference of 0.37%). Similarly, the demographic groups most similar to Ecuadorians are Immigrants from Panama ($45,198, a difference of 0.030%), White/Caucasian ($45,197, a difference of 0.040%), West Indian ($45,132, a difference of 0.18%), Immigrants from Cambodia ($45,090, a difference of 0.28%), and Dutch ($45,370, a difference of 0.35%).
| Demographics | Rating | Rank | Median Earnings |
| Immigrants | Grenada | 23.6 /100 | #210 | Fair $45,596 |
| Panamanians | 23.5 /100 | #211 | Fair $45,593 |
| Bermudans | 23.5 /100 | #212 | Fair $45,593 |
| Immigrants | Colombia | 22.4 /100 | #213 | Fair $45,550 |
| Nigerians | 22.0 /100 | #214 | Fair $45,532 |
| Immigrants | Bangladesh | 22.0 /100 | #215 | Fair $45,532 |
| Guyanese | 20.6 /100 | #216 | Fair $45,470 |
| Tlingit-Haida | 20.5 /100 | #217 | Fair $45,468 |
| Spanish | 19.7 /100 | #218 | Poor $45,432 |
| Dutch | 18.4 /100 | #219 | Poor $45,370 |
| Ecuadorians | 15.3 /100 | #220 | Poor $45,214 |
| Immigrants | Guyana | 15.1 /100 | #221 | Poor $45,204 |
| Immigrants | Panama | 15.0 /100 | #222 | Poor $45,198 |
| Whites/Caucasians | 15.0 /100 | #223 | Poor $45,197 |
| West Indians | 13.9 /100 | #224 | Poor $45,132 |
| Immigrants | Cambodia | 13.2 /100 | #225 | Poor $45,090 |
| Immigrants | Nigeria | 12.2 /100 | #226 | Poor $45,030 |
| Native Hawaiians | 12.2 /100 | #227 | Poor $45,027 |
| Immigrants | Iraq | 11.6 /100 | #228 | Poor $44,988 |
| Scotch-Irish | 10.7 /100 | #229 | Poor $44,924 |
| Immigrants | Western Africa | 10.3 /100 | #230 | Poor $44,893 |