Immigrants from Guyana vs Welsh Median Earnings
COMPARE
Immigrants from Guyana
Welsh
Median Earnings
Median Earnings Comparison
Immigrants from Guyana
Welsh
$45,204
MEDIAN EARNINGS
15.1/ 100
METRIC RATING
221st/ 347
METRIC RANK
$45,710
MEDIAN EARNINGS
26.6/ 100
METRIC RATING
203rd/ 347
METRIC RANK
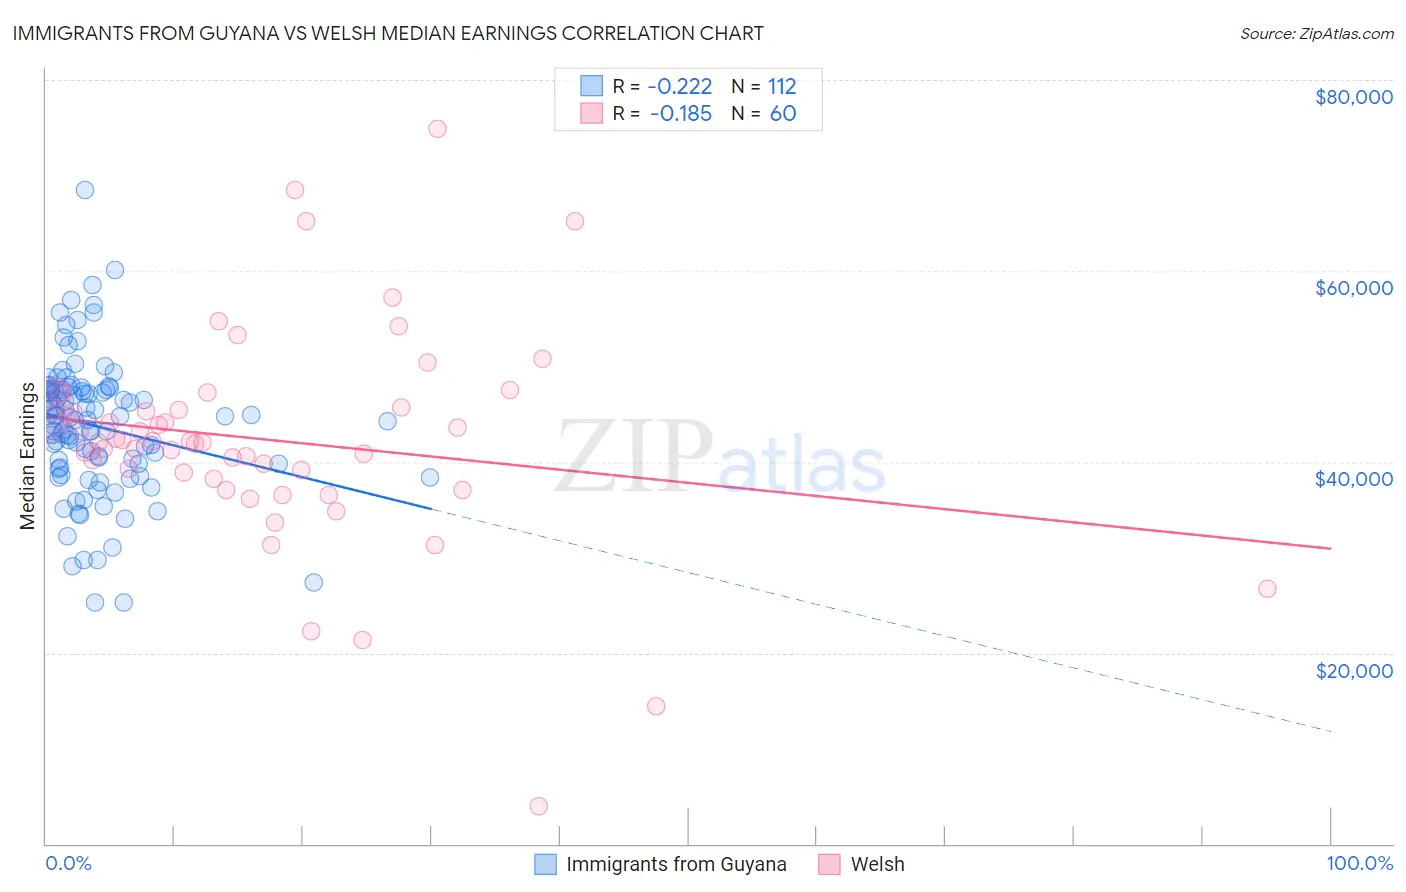
Immigrants from Guyana vs Welsh Median Earnings Correlation Chart
The statistical analysis conducted on geographies consisting of 183,726,948 people shows a weak negative correlation between the proportion of Immigrants from Guyana and median earnings in the United States with a correlation coefficient (R) of -0.222 and weighted average of $45,204. Similarly, the statistical analysis conducted on geographies consisting of 528,402,039 people shows a poor negative correlation between the proportion of Welsh and median earnings in the United States with a correlation coefficient (R) of -0.185 and weighted average of $45,710, a difference of 1.1%.
Median Earnings Correlation Summary
| Measurement | Immigrants from Guyana | Welsh |
| Minimum | $25,266 | $3,902 |
| Maximum | $68,439 | $74,844 |
| Range | $43,174 | $70,942 |
| Mean | $43,730 | $42,284 |
| Median | $44,540 | $42,106 |
| Interquartile 25% (IQ1) | $39,599 | $38,560 |
| Interquartile 75% (IQ3) | $47,563 | $45,605 |
| Interquartile Range (IQR) | $7,964 | $7,045 |
| Standard Deviation (Sample) | $7,179 | $11,412 |
| Standard Deviation (Population) | $7,147 | $11,316 |
Demographics Similar to Immigrants from Guyana and Welsh by Median Earnings
In terms of median earnings, the demographic groups most similar to Immigrants from Guyana are Immigrants from Panama ($45,198, a difference of 0.010%), Ecuadorian ($45,214, a difference of 0.020%), Dutch ($45,370, a difference of 0.37%), Spanish ($45,432, a difference of 0.50%), and Tlingit-Haida ($45,468, a difference of 0.58%). Similarly, the demographic groups most similar to Welsh are Immigrants from Trinidad and Tobago ($45,729, a difference of 0.040%), Immigrants from Uruguay ($45,682, a difference of 0.060%), Tongan ($45,665, a difference of 0.10%), Immigrants from Ghana ($45,641, a difference of 0.15%), and Immigrants from Senegal ($45,611, a difference of 0.22%).
| Demographics | Rating | Rank | Median Earnings |
| Immigrants | Trinidad and Tobago | 27.1 /100 | #202 | Fair $45,729 |
| Welsh | 26.6 /100 | #203 | Fair $45,710 |
| Immigrants | Uruguay | 25.9 /100 | #204 | Fair $45,682 |
| Tongans | 25.4 /100 | #205 | Fair $45,665 |
| Immigrants | Ghana | 24.8 /100 | #206 | Fair $45,641 |
| Immigrants | Senegal | 24.0 /100 | #207 | Fair $45,611 |
| Immigrants | Bosnia and Herzegovina | 23.7 /100 | #208 | Fair $45,600 |
| Immigrants | Thailand | 23.7 /100 | #209 | Fair $45,598 |
| Immigrants | Grenada | 23.6 /100 | #210 | Fair $45,596 |
| Panamanians | 23.5 /100 | #211 | Fair $45,593 |
| Bermudans | 23.5 /100 | #212 | Fair $45,593 |
| Immigrants | Colombia | 22.4 /100 | #213 | Fair $45,550 |
| Nigerians | 22.0 /100 | #214 | Fair $45,532 |
| Immigrants | Bangladesh | 22.0 /100 | #215 | Fair $45,532 |
| Guyanese | 20.6 /100 | #216 | Fair $45,470 |
| Tlingit-Haida | 20.5 /100 | #217 | Fair $45,468 |
| Spanish | 19.7 /100 | #218 | Poor $45,432 |
| Dutch | 18.4 /100 | #219 | Poor $45,370 |
| Ecuadorians | 15.3 /100 | #220 | Poor $45,214 |
| Immigrants | Guyana | 15.1 /100 | #221 | Poor $45,204 |
| Immigrants | Panama | 15.0 /100 | #222 | Poor $45,198 |