Immigrants from Europe vs Puget Sound Salish Median Earnings
COMPARE
Immigrants from Europe
Puget Sound Salish
Median Earnings
Median Earnings Comparison
Immigrants from Europe
Puget Sound Salish
$52,195
MEDIAN EARNINGS
100.0/ 100
METRIC RATING
48th/ 347
METRIC RANK
$46,333
MEDIAN EARNINGS
46.5/ 100
METRIC RATING
180th/ 347
METRIC RANK
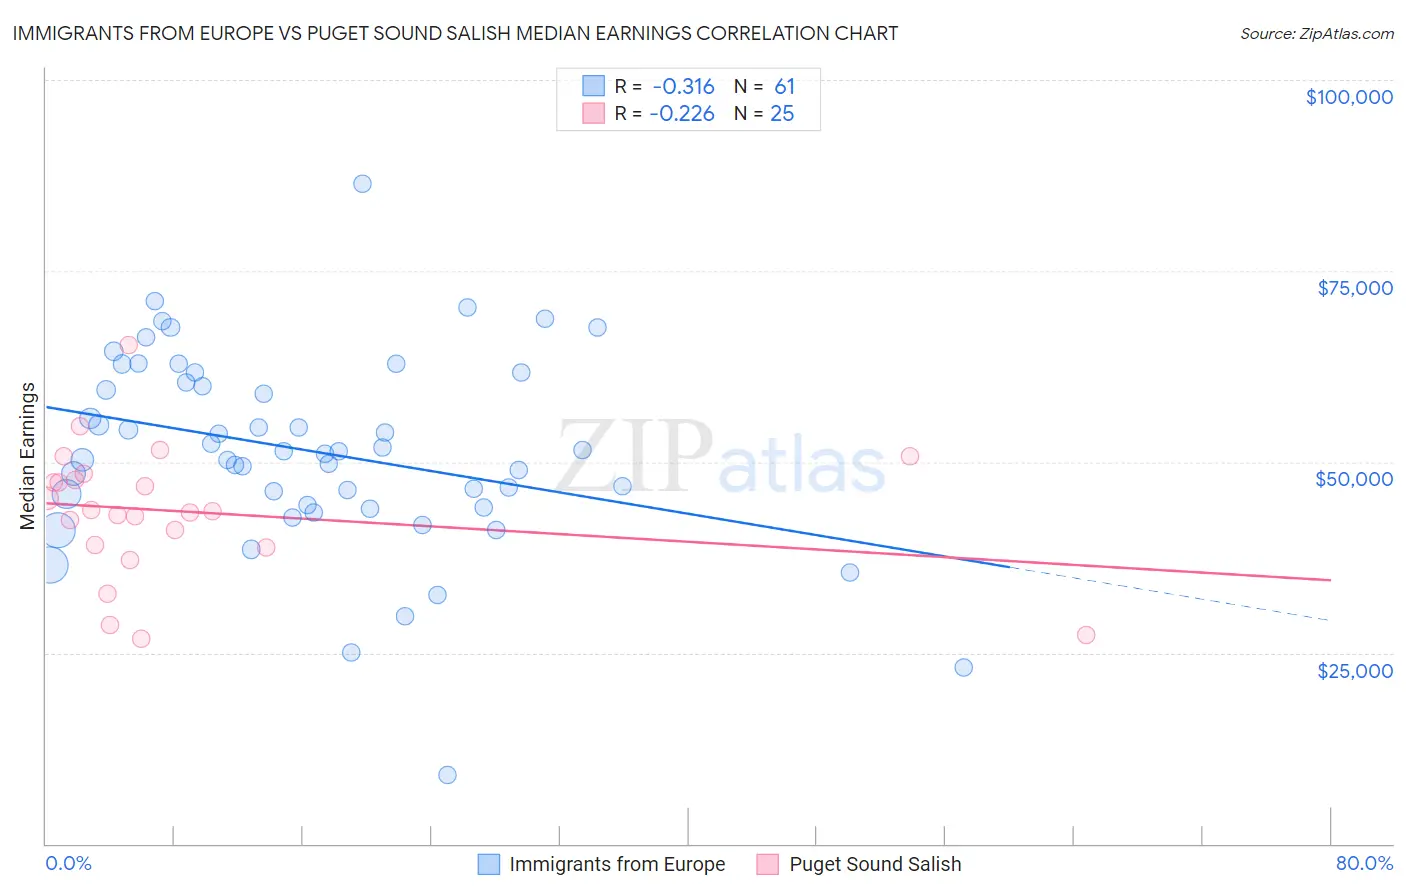
Immigrants from Europe vs Puget Sound Salish Median Earnings Correlation Chart
The statistical analysis conducted on geographies consisting of 547,237,695 people shows a mild negative correlation between the proportion of Immigrants from Europe and median earnings in the United States with a correlation coefficient (R) of -0.316 and weighted average of $52,195. Similarly, the statistical analysis conducted on geographies consisting of 46,155,746 people shows a weak negative correlation between the proportion of Puget Sound Salish and median earnings in the United States with a correlation coefficient (R) of -0.226 and weighted average of $46,333, a difference of 12.7%.
Median Earnings Correlation Summary
| Measurement | Immigrants from Europe | Puget Sound Salish |
| Minimum | $9,082 | $26,875 |
| Maximum | $86,483 | $65,298 |
| Range | $77,401 | $38,423 |
| Mean | $51,354 | $43,450 |
| Median | $51,399 | $43,514 |
| Interquartile 25% (IQ1) | $44,212 | $38,912 |
| Interquartile 75% (IQ3) | $60,990 | $47,991 |
| Interquartile Range (IQR) | $16,778 | $9,079 |
| Standard Deviation (Sample) | $12,967 | $8,689 |
| Standard Deviation (Population) | $12,860 | $8,513 |
Similar Demographics by Median Earnings
Demographics Similar to Immigrants from Europe by Median Earnings
In terms of median earnings, the demographic groups most similar to Immigrants from Europe are Australian ($52,294, a difference of 0.19%), Bhutanese ($52,297, a difference of 0.20%), Immigrants from Czechoslovakia ($52,361, a difference of 0.32%), Bolivian ($52,005, a difference of 0.37%), and Immigrants from Malaysia ($52,514, a difference of 0.61%).
| Demographics | Rating | Rank | Median Earnings |
| Immigrants | Lithuania | 100.0 /100 | #41 | Exceptional $52,769 |
| Maltese | 100.0 /100 | #42 | Exceptional $52,526 |
| Immigrants | Malaysia | 100.0 /100 | #43 | Exceptional $52,514 |
| Bulgarians | 100.0 /100 | #44 | Exceptional $52,512 |
| Immigrants | Czechoslovakia | 100.0 /100 | #45 | Exceptional $52,361 |
| Bhutanese | 100.0 /100 | #46 | Exceptional $52,297 |
| Australians | 100.0 /100 | #47 | Exceptional $52,294 |
| Immigrants | Europe | 100.0 /100 | #48 | Exceptional $52,195 |
| Bolivians | 100.0 /100 | #49 | Exceptional $52,005 |
| Immigrants | South Africa | 100.0 /100 | #50 | Exceptional $51,850 |
| Immigrants | Austria | 99.9 /100 | #51 | Exceptional $51,826 |
| Estonians | 99.9 /100 | #52 | Exceptional $51,772 |
| Immigrants | Norway | 99.9 /100 | #53 | Exceptional $51,758 |
| Immigrants | Indonesia | 99.9 /100 | #54 | Exceptional $51,715 |
| Egyptians | 99.9 /100 | #55 | Exceptional $51,701 |
Demographics Similar to Puget Sound Salish by Median Earnings
In terms of median earnings, the demographic groups most similar to Puget Sound Salish are English ($46,334, a difference of 0.0%), Immigrants from Cameroon ($46,329, a difference of 0.010%), Colombian ($46,349, a difference of 0.040%), Swiss ($46,315, a difference of 0.040%), and French ($46,296, a difference of 0.080%).
| Demographics | Rating | Rank | Median Earnings |
| Ghanaians | 50.3 /100 | #173 | Average $46,440 |
| Scandinavians | 50.0 /100 | #174 | Average $46,433 |
| Basques | 48.8 /100 | #175 | Average $46,399 |
| Danes | 48.6 /100 | #176 | Average $46,392 |
| Belgians | 48.0 /100 | #177 | Average $46,375 |
| Colombians | 47.1 /100 | #178 | Average $46,349 |
| English | 46.5 /100 | #179 | Average $46,334 |
| Puget Sound Salish | 46.5 /100 | #180 | Average $46,333 |
| Immigrants | Cameroon | 46.4 /100 | #181 | Average $46,329 |
| Swiss | 45.9 /100 | #182 | Average $46,315 |
| French | 45.2 /100 | #183 | Average $46,296 |
| Immigrants | Kenya | 42.4 /100 | #184 | Average $46,214 |
| Uruguayans | 41.6 /100 | #185 | Average $46,190 |
| Vietnamese | 40.9 /100 | #186 | Average $46,172 |
| Iraqis | 39.9 /100 | #187 | Fair $46,140 |