Immigrants from Ethiopia vs Puget Sound Salish Median Earnings
COMPARE
Immigrants from Ethiopia
Puget Sound Salish
Median Earnings
Median Earnings Comparison
Immigrants from Ethiopia
Puget Sound Salish
$48,924
MEDIAN EARNINGS
97.1/ 100
METRIC RATING
110th/ 347
METRIC RANK
$46,333
MEDIAN EARNINGS
46.5/ 100
METRIC RATING
180th/ 347
METRIC RANK
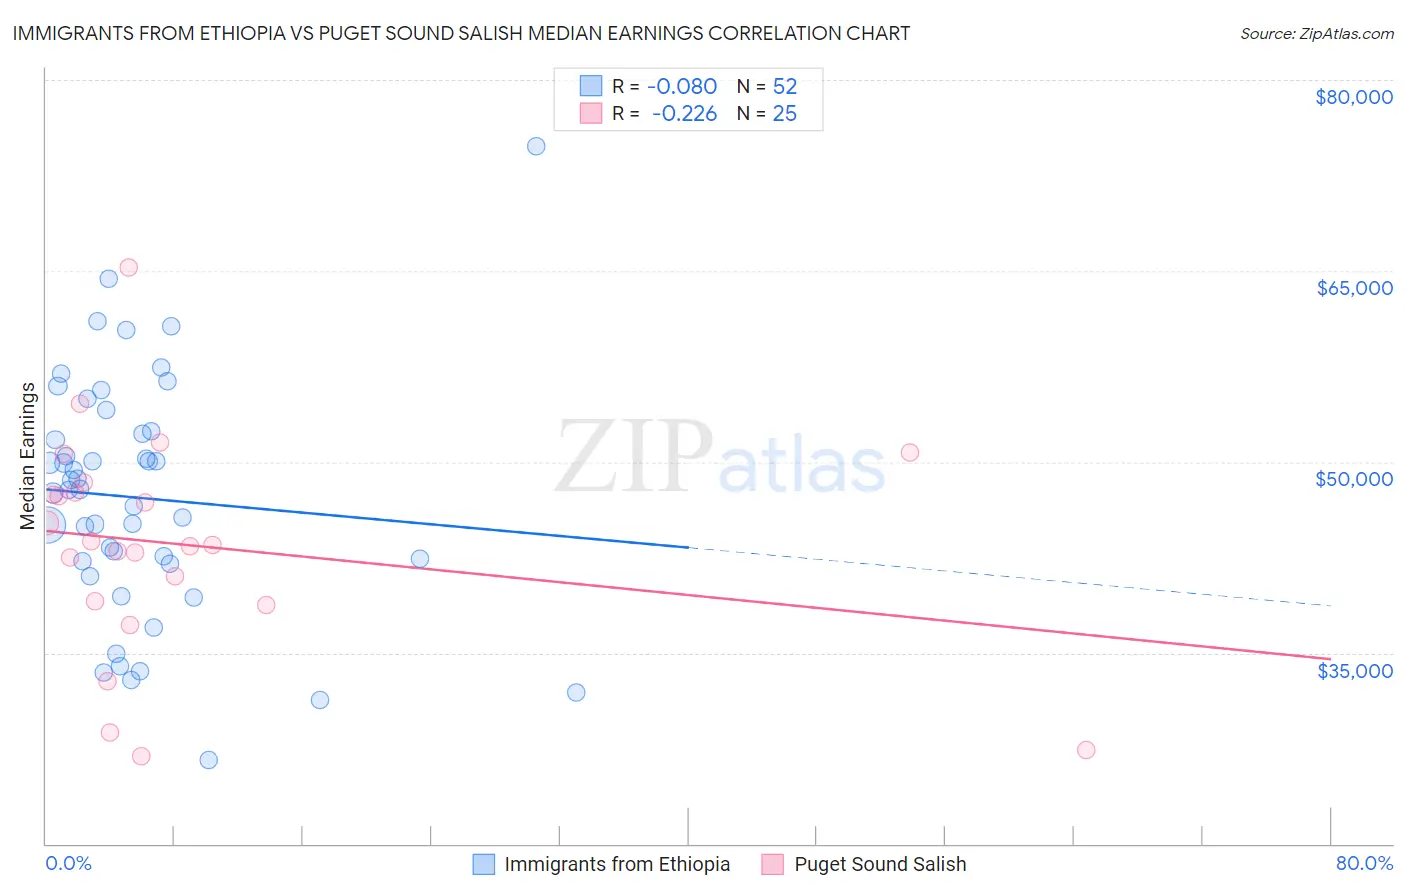
Immigrants from Ethiopia vs Puget Sound Salish Median Earnings Correlation Chart
The statistical analysis conducted on geographies consisting of 211,566,238 people shows a slight negative correlation between the proportion of Immigrants from Ethiopia and median earnings in the United States with a correlation coefficient (R) of -0.080 and weighted average of $48,924. Similarly, the statistical analysis conducted on geographies consisting of 46,155,746 people shows a weak negative correlation between the proportion of Puget Sound Salish and median earnings in the United States with a correlation coefficient (R) of -0.226 and weighted average of $46,333, a difference of 5.6%.
Median Earnings Correlation Summary
| Measurement | Immigrants from Ethiopia | Puget Sound Salish |
| Minimum | $26,567 | $26,875 |
| Maximum | $74,844 | $65,298 |
| Range | $48,277 | $38,423 |
| Mean | $47,171 | $43,450 |
| Median | $47,805 | $43,514 |
| Interquartile 25% (IQ1) | $42,088 | $38,912 |
| Interquartile 75% (IQ3) | $52,349 | $47,991 |
| Interquartile Range (IQR) | $10,261 | $9,079 |
| Standard Deviation (Sample) | $9,417 | $8,689 |
| Standard Deviation (Population) | $9,326 | $8,513 |
Similar Demographics by Median Earnings
Demographics Similar to Immigrants from Ethiopia by Median Earnings
In terms of median earnings, the demographic groups most similar to Immigrants from Ethiopia are Syrian ($48,934, a difference of 0.020%), Immigrants from Zimbabwe ($48,913, a difference of 0.020%), Northern European ($48,887, a difference of 0.070%), Immigrants from Kuwait ($48,861, a difference of 0.13%), and Moroccan ($48,838, a difference of 0.17%).
| Demographics | Rating | Rank | Median Earnings |
| Austrians | 98.7 /100 | #103 | Exceptional $49,501 |
| Immigrants | Brazil | 98.6 /100 | #104 | Exceptional $49,463 |
| Immigrants | Western Asia | 98.4 /100 | #105 | Exceptional $49,389 |
| Immigrants | Albania | 98.4 /100 | #106 | Exceptional $49,377 |
| Immigrants | Morocco | 98.4 /100 | #107 | Exceptional $49,368 |
| Palestinians | 98.0 /100 | #108 | Exceptional $49,209 |
| Syrians | 97.1 /100 | #109 | Exceptional $48,934 |
| Immigrants | Ethiopia | 97.1 /100 | #110 | Exceptional $48,924 |
| Immigrants | Zimbabwe | 97.0 /100 | #111 | Exceptional $48,913 |
| Northern Europeans | 96.9 /100 | #112 | Exceptional $48,887 |
| Immigrants | Kuwait | 96.8 /100 | #113 | Exceptional $48,861 |
| Moroccans | 96.7 /100 | #114 | Exceptional $48,838 |
| Chinese | 96.7 /100 | #115 | Exceptional $48,836 |
| Koreans | 96.2 /100 | #116 | Exceptional $48,727 |
| Serbians | 95.9 /100 | #117 | Exceptional $48,677 |
Demographics Similar to Puget Sound Salish by Median Earnings
In terms of median earnings, the demographic groups most similar to Puget Sound Salish are English ($46,334, a difference of 0.0%), Immigrants from Cameroon ($46,329, a difference of 0.010%), Colombian ($46,349, a difference of 0.040%), Swiss ($46,315, a difference of 0.040%), and French ($46,296, a difference of 0.080%).
| Demographics | Rating | Rank | Median Earnings |
| Ghanaians | 50.3 /100 | #173 | Average $46,440 |
| Scandinavians | 50.0 /100 | #174 | Average $46,433 |
| Basques | 48.8 /100 | #175 | Average $46,399 |
| Danes | 48.6 /100 | #176 | Average $46,392 |
| Belgians | 48.0 /100 | #177 | Average $46,375 |
| Colombians | 47.1 /100 | #178 | Average $46,349 |
| English | 46.5 /100 | #179 | Average $46,334 |
| Puget Sound Salish | 46.5 /100 | #180 | Average $46,333 |
| Immigrants | Cameroon | 46.4 /100 | #181 | Average $46,329 |
| Swiss | 45.9 /100 | #182 | Average $46,315 |
| French | 45.2 /100 | #183 | Average $46,296 |
| Immigrants | Kenya | 42.4 /100 | #184 | Average $46,214 |
| Uruguayans | 41.6 /100 | #185 | Average $46,190 |
| Vietnamese | 40.9 /100 | #186 | Average $46,172 |
| Iraqis | 39.9 /100 | #187 | Fair $46,140 |