Immigrants from Guyana vs Immigrants from Ukraine Median Earnings
COMPARE
Immigrants from Guyana
Immigrants from Ukraine
Median Earnings
Median Earnings Comparison
Immigrants from Guyana
Immigrants from Ukraine
$45,204
MEDIAN EARNINGS
15.1/ 100
METRIC RATING
221st/ 347
METRIC RANK
$50,984
MEDIAN EARNINGS
99.8/ 100
METRIC RATING
71st/ 347
METRIC RANK
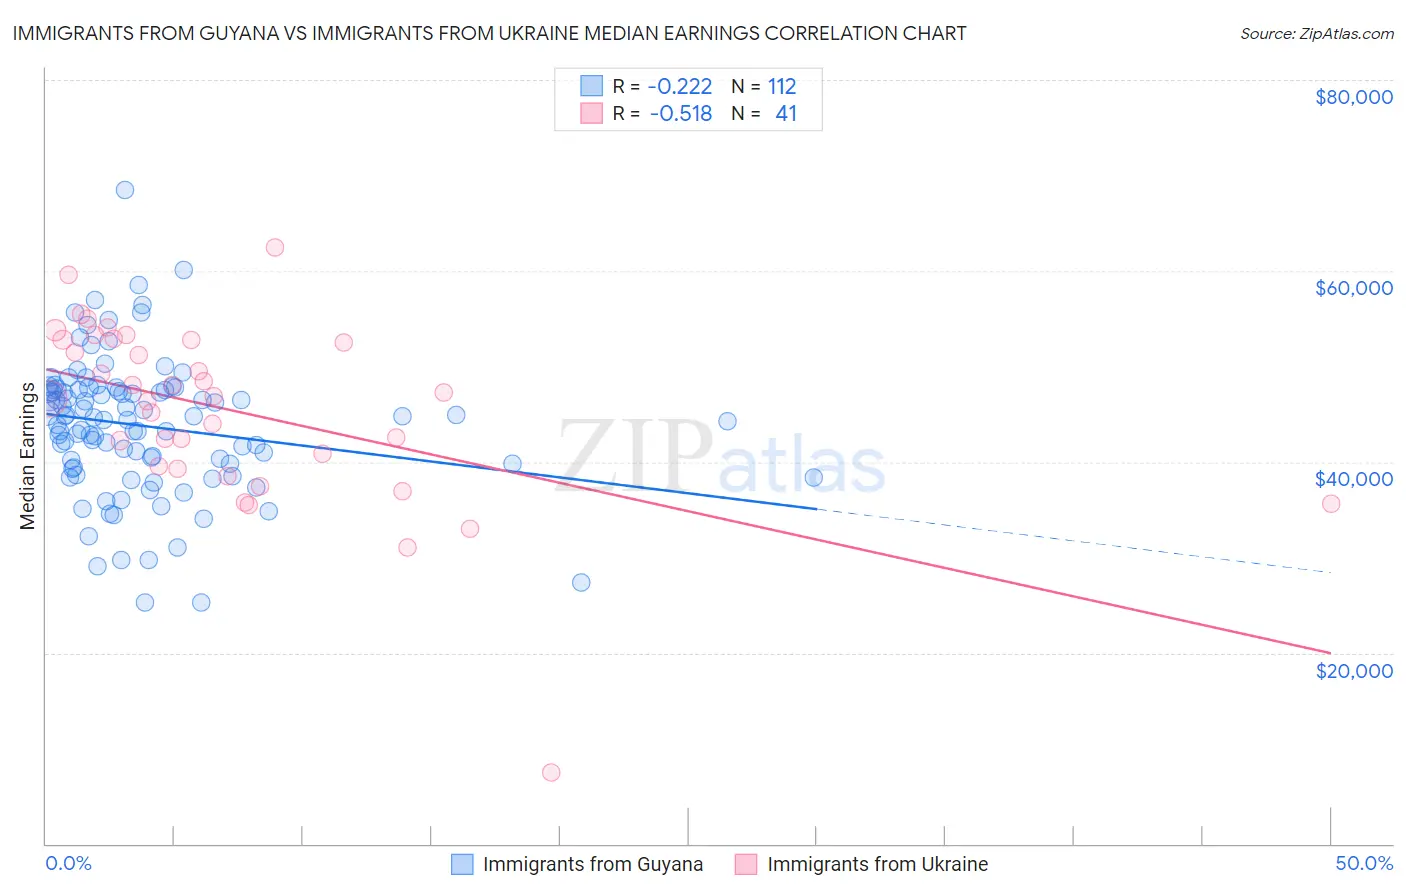
Immigrants from Guyana vs Immigrants from Ukraine Median Earnings Correlation Chart
The statistical analysis conducted on geographies consisting of 183,726,948 people shows a weak negative correlation between the proportion of Immigrants from Guyana and median earnings in the United States with a correlation coefficient (R) of -0.222 and weighted average of $45,204. Similarly, the statistical analysis conducted on geographies consisting of 289,705,710 people shows a substantial negative correlation between the proportion of Immigrants from Ukraine and median earnings in the United States with a correlation coefficient (R) of -0.518 and weighted average of $50,984, a difference of 12.8%.
Median Earnings Correlation Summary
| Measurement | Immigrants from Guyana | Immigrants from Ukraine |
| Minimum | $25,266 | $7,500 |
| Maximum | $68,439 | $62,500 |
| Range | $43,174 | $55,000 |
| Mean | $43,730 | $45,386 |
| Median | $44,540 | $46,915 |
| Interquartile 25% (IQ1) | $39,599 | $39,380 |
| Interquartile 75% (IQ3) | $47,563 | $52,800 |
| Interquartile Range (IQR) | $7,964 | $13,420 |
| Standard Deviation (Sample) | $7,179 | $9,626 |
| Standard Deviation (Population) | $7,147 | $9,508 |
Similar Demographics by Median Earnings
Demographics Similar to Immigrants from Guyana by Median Earnings
In terms of median earnings, the demographic groups most similar to Immigrants from Guyana are Immigrants from Panama ($45,198, a difference of 0.010%), Ecuadorian ($45,214, a difference of 0.020%), White/Caucasian ($45,197, a difference of 0.020%), West Indian ($45,132, a difference of 0.16%), and Immigrants from Cambodia ($45,090, a difference of 0.25%).
| Demographics | Rating | Rank | Median Earnings |
| Nigerians | 22.0 /100 | #214 | Fair $45,532 |
| Immigrants | Bangladesh | 22.0 /100 | #215 | Fair $45,532 |
| Guyanese | 20.6 /100 | #216 | Fair $45,470 |
| Tlingit-Haida | 20.5 /100 | #217 | Fair $45,468 |
| Spanish | 19.7 /100 | #218 | Poor $45,432 |
| Dutch | 18.4 /100 | #219 | Poor $45,370 |
| Ecuadorians | 15.3 /100 | #220 | Poor $45,214 |
| Immigrants | Guyana | 15.1 /100 | #221 | Poor $45,204 |
| Immigrants | Panama | 15.0 /100 | #222 | Poor $45,198 |
| Whites/Caucasians | 15.0 /100 | #223 | Poor $45,197 |
| West Indians | 13.9 /100 | #224 | Poor $45,132 |
| Immigrants | Cambodia | 13.2 /100 | #225 | Poor $45,090 |
| Immigrants | Nigeria | 12.2 /100 | #226 | Poor $45,030 |
| Native Hawaiians | 12.2 /100 | #227 | Poor $45,027 |
| Immigrants | Iraq | 11.6 /100 | #228 | Poor $44,988 |
Demographics Similar to Immigrants from Ukraine by Median Earnings
In terms of median earnings, the demographic groups most similar to Immigrants from Ukraine are Lithuanian ($50,991, a difference of 0.010%), Mongolian ($51,038, a difference of 0.10%), Paraguayan ($51,068, a difference of 0.16%), Immigrants from Egypt ($50,901, a difference of 0.16%), and Immigrants from Spain ($51,092, a difference of 0.21%).
| Demographics | Rating | Rank | Median Earnings |
| New Zealanders | 99.9 /100 | #64 | Exceptional $51,246 |
| Greeks | 99.9 /100 | #65 | Exceptional $51,164 |
| Afghans | 99.9 /100 | #66 | Exceptional $51,112 |
| Immigrants | Spain | 99.9 /100 | #67 | Exceptional $51,092 |
| Paraguayans | 99.9 /100 | #68 | Exceptional $51,068 |
| Mongolians | 99.8 /100 | #69 | Exceptional $51,038 |
| Lithuanians | 99.8 /100 | #70 | Exceptional $50,991 |
| Immigrants | Ukraine | 99.8 /100 | #71 | Exceptional $50,984 |
| Immigrants | Egypt | 99.8 /100 | #72 | Exceptional $50,901 |
| Immigrants | Netherlands | 99.8 /100 | #73 | Exceptional $50,818 |
| South Africans | 99.8 /100 | #74 | Exceptional $50,752 |
| Immigrants | Scotland | 99.8 /100 | #75 | Exceptional $50,741 |
| Immigrants | Italy | 99.7 /100 | #76 | Exceptional $50,581 |
| Immigrants | Western Europe | 99.7 /100 | #77 | Exceptional $50,549 |
| Argentineans | 99.6 /100 | #78 | Exceptional $50,399 |