Immigrants from the Azores vs Puget Sound Salish Median Earnings
COMPARE
Immigrants from the Azores
Puget Sound Salish
Median Earnings
Median Earnings Comparison
Immigrants from the Azores
Puget Sound Salish
$45,812
MEDIAN EARNINGS
29.5/ 100
METRIC RATING
200th/ 347
METRIC RANK
$46,333
MEDIAN EARNINGS
46.5/ 100
METRIC RATING
180th/ 347
METRIC RANK
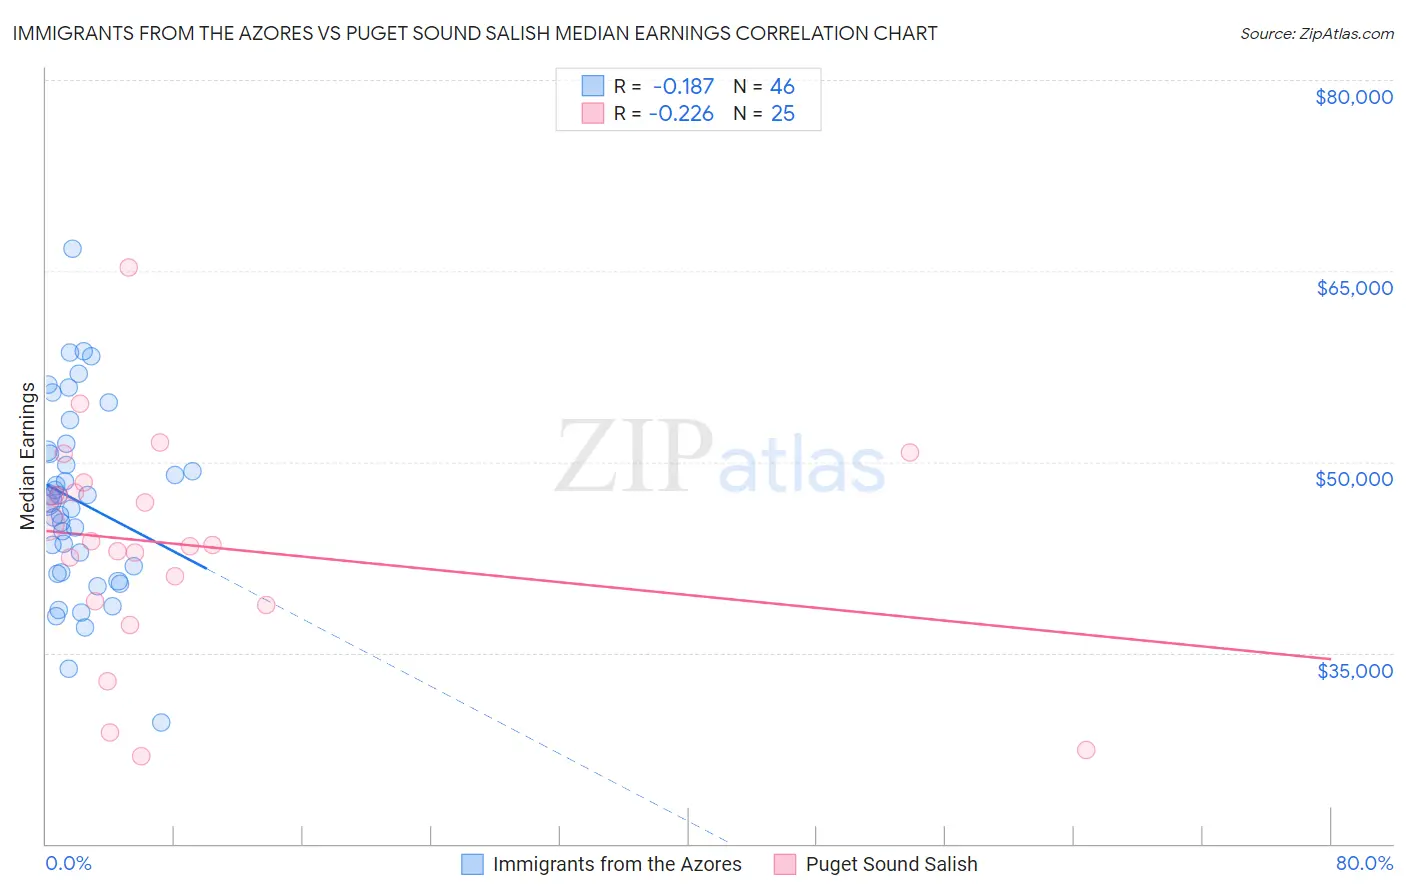
Immigrants from the Azores vs Puget Sound Salish Median Earnings Correlation Chart
The statistical analysis conducted on geographies consisting of 46,253,253 people shows a poor negative correlation between the proportion of Immigrants from the Azores and median earnings in the United States with a correlation coefficient (R) of -0.187 and weighted average of $45,812. Similarly, the statistical analysis conducted on geographies consisting of 46,155,746 people shows a weak negative correlation between the proportion of Puget Sound Salish and median earnings in the United States with a correlation coefficient (R) of -0.226 and weighted average of $46,333, a difference of 1.1%.
Median Earnings Correlation Summary
| Measurement | Immigrants from the Azores | Puget Sound Salish |
| Minimum | $29,500 | $26,875 |
| Maximum | $66,731 | $65,298 |
| Range | $37,231 | $38,423 |
| Mean | $46,892 | $43,450 |
| Median | $46,853 | $43,514 |
| Interquartile 25% (IQ1) | $41,350 | $38,912 |
| Interquartile 75% (IQ3) | $50,852 | $47,991 |
| Interquartile Range (IQR) | $9,501 | $9,079 |
| Standard Deviation (Sample) | $7,383 | $8,689 |
| Standard Deviation (Population) | $7,302 | $8,513 |
Demographics Similar to Immigrants from the Azores and Puget Sound Salish by Median Earnings
In terms of median earnings, the demographic groups most similar to Immigrants from the Azores are Immigrants from Barbados ($45,816, a difference of 0.010%), Trinidadian and Tobagonian ($45,820, a difference of 0.020%), Yugoslavian ($45,846, a difference of 0.070%), Barbadian ($45,846, a difference of 0.070%), and Immigrants from St. Vincent and the Grenadines ($45,908, a difference of 0.21%). Similarly, the demographic groups most similar to Puget Sound Salish are Immigrants from Cameroon ($46,329, a difference of 0.010%), Swiss ($46,315, a difference of 0.040%), French ($46,296, a difference of 0.080%), Immigrants from Kenya ($46,214, a difference of 0.26%), and Uruguayan ($46,190, a difference of 0.31%).
| Demographics | Rating | Rank | Median Earnings |
| Puget Sound Salish | 46.5 /100 | #180 | Average $46,333 |
| Immigrants | Cameroon | 46.4 /100 | #181 | Average $46,329 |
| Swiss | 45.9 /100 | #182 | Average $46,315 |
| French | 45.2 /100 | #183 | Average $46,296 |
| Immigrants | Kenya | 42.4 /100 | #184 | Average $46,214 |
| Uruguayans | 41.6 /100 | #185 | Average $46,190 |
| Vietnamese | 40.9 /100 | #186 | Average $46,172 |
| Iraqis | 39.9 /100 | #187 | Fair $46,140 |
| Immigrants | Armenia | 38.3 /100 | #188 | Fair $46,094 |
| Spaniards | 37.2 /100 | #189 | Fair $46,059 |
| French Canadians | 36.1 /100 | #190 | Fair $46,026 |
| Finns | 33.4 /100 | #191 | Fair $45,940 |
| Germans | 33.2 /100 | #192 | Fair $45,935 |
| Guamanians/Chamorros | 33.2 /100 | #193 | Fair $45,933 |
| Immigrants | Costa Rica | 33.0 /100 | #194 | Fair $45,928 |
| Immigrants | St. Vincent and the Grenadines | 32.4 /100 | #195 | Fair $45,908 |
| Yugoslavians | 30.5 /100 | #196 | Fair $45,846 |
| Barbadians | 30.5 /100 | #197 | Fair $45,846 |
| Trinidadians and Tobagonians | 29.7 /100 | #198 | Fair $45,820 |
| Immigrants | Barbados | 29.6 /100 | #199 | Fair $45,816 |
| Immigrants | Azores | 29.5 /100 | #200 | Fair $45,812 |