Cherokee vs Puget Sound Salish Median Earnings
COMPARE
Cherokee
Puget Sound Salish
Median Earnings
Median Earnings Comparison
Cherokee
Puget Sound Salish
$41,252
MEDIAN EARNINGS
0.1/ 100
METRIC RATING
296th/ 347
METRIC RANK
$46,333
MEDIAN EARNINGS
46.5/ 100
METRIC RATING
180th/ 347
METRIC RANK
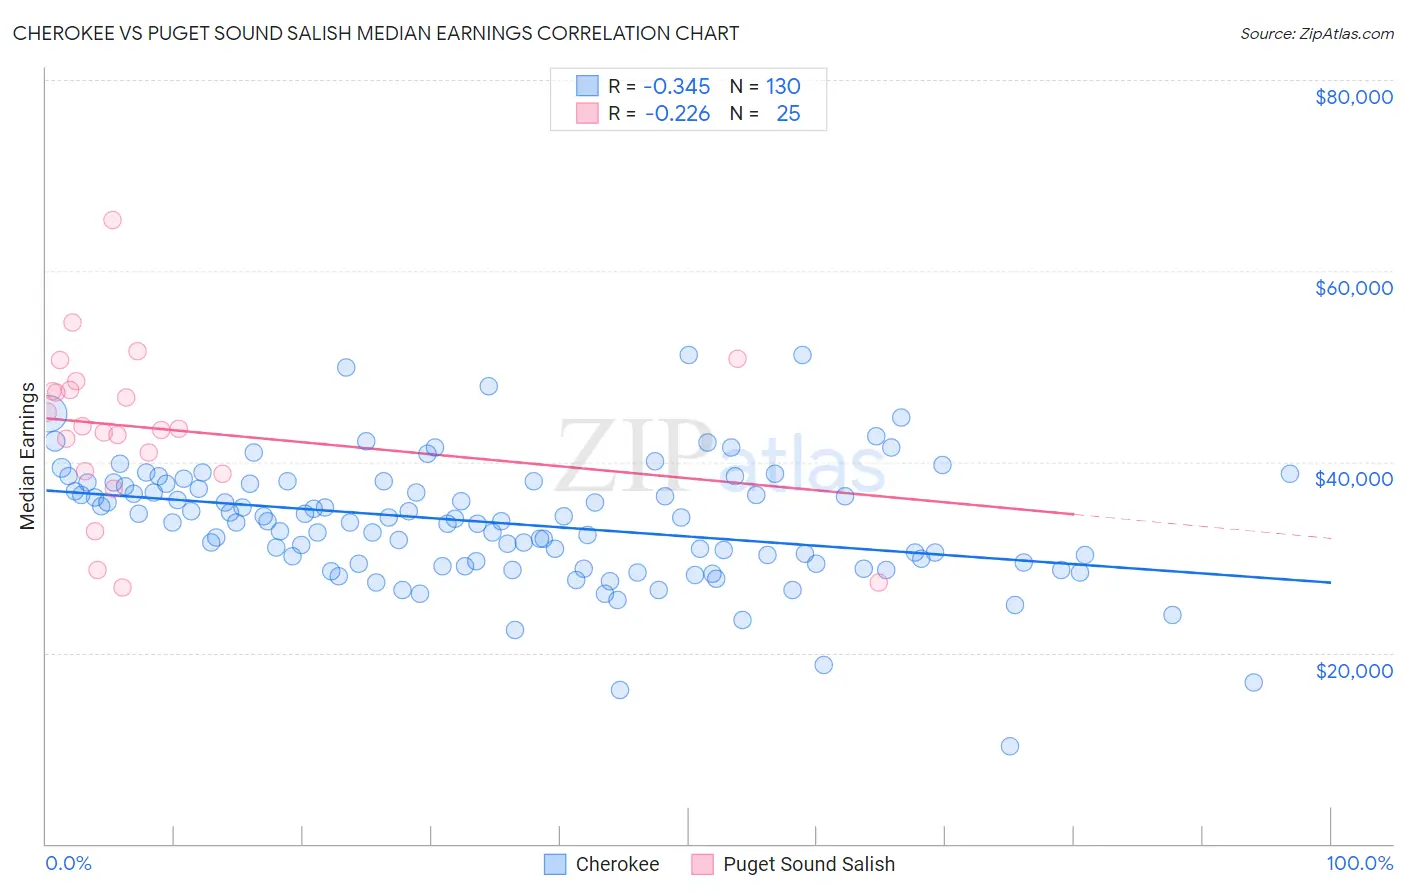
Cherokee vs Puget Sound Salish Median Earnings Correlation Chart
The statistical analysis conducted on geographies consisting of 493,557,174 people shows a mild negative correlation between the proportion of Cherokee and median earnings in the United States with a correlation coefficient (R) of -0.345 and weighted average of $41,252. Similarly, the statistical analysis conducted on geographies consisting of 46,155,746 people shows a weak negative correlation between the proportion of Puget Sound Salish and median earnings in the United States with a correlation coefficient (R) of -0.226 and weighted average of $46,333, a difference of 12.3%.
Median Earnings Correlation Summary
| Measurement | Cherokee | Puget Sound Salish |
| Minimum | $10,267 | $26,875 |
| Maximum | $51,250 | $65,298 |
| Range | $40,983 | $38,423 |
| Mean | $33,603 | $43,450 |
| Median | $33,784 | $43,514 |
| Interquartile 25% (IQ1) | $29,375 | $38,912 |
| Interquartile 75% (IQ3) | $37,767 | $47,991 |
| Interquartile Range (IQR) | $8,392 | $9,079 |
| Standard Deviation (Sample) | $6,429 | $8,689 |
| Standard Deviation (Population) | $6,404 | $8,513 |
Similar Demographics by Median Earnings
Demographics Similar to Cherokee by Median Earnings
In terms of median earnings, the demographic groups most similar to Cherokee are Bangladeshi ($41,263, a difference of 0.030%), Potawatomi ($41,288, a difference of 0.090%), Guatemalan ($41,205, a difference of 0.11%), Immigrants from Zaire ($41,325, a difference of 0.18%), and Immigrants from Micronesia ($41,133, a difference of 0.29%).
| Demographics | Rating | Rank | Median Earnings |
| Comanche | 0.1 /100 | #289 | Tragic $41,519 |
| Paiute | 0.1 /100 | #290 | Tragic $41,508 |
| Central American Indians | 0.1 /100 | #291 | Tragic $41,474 |
| U.S. Virgin Islanders | 0.1 /100 | #292 | Tragic $41,448 |
| Immigrants | Zaire | 0.1 /100 | #293 | Tragic $41,325 |
| Potawatomi | 0.1 /100 | #294 | Tragic $41,288 |
| Bangladeshis | 0.1 /100 | #295 | Tragic $41,263 |
| Cherokee | 0.1 /100 | #296 | Tragic $41,252 |
| Guatemalans | 0.1 /100 | #297 | Tragic $41,205 |
| Immigrants | Micronesia | 0.1 /100 | #298 | Tragic $41,133 |
| Immigrants | Caribbean | 0.1 /100 | #299 | Tragic $41,119 |
| Ute | 0.1 /100 | #300 | Tragic $41,051 |
| Immigrants | Latin America | 0.1 /100 | #301 | Tragic $41,049 |
| Shoshone | 0.0 /100 | #302 | Tragic $40,932 |
| Haitians | 0.0 /100 | #303 | Tragic $40,918 |
Demographics Similar to Puget Sound Salish by Median Earnings
In terms of median earnings, the demographic groups most similar to Puget Sound Salish are English ($46,334, a difference of 0.0%), Immigrants from Cameroon ($46,329, a difference of 0.010%), Colombian ($46,349, a difference of 0.040%), Swiss ($46,315, a difference of 0.040%), and French ($46,296, a difference of 0.080%).
| Demographics | Rating | Rank | Median Earnings |
| Ghanaians | 50.3 /100 | #173 | Average $46,440 |
| Scandinavians | 50.0 /100 | #174 | Average $46,433 |
| Basques | 48.8 /100 | #175 | Average $46,399 |
| Danes | 48.6 /100 | #176 | Average $46,392 |
| Belgians | 48.0 /100 | #177 | Average $46,375 |
| Colombians | 47.1 /100 | #178 | Average $46,349 |
| English | 46.5 /100 | #179 | Average $46,334 |
| Puget Sound Salish | 46.5 /100 | #180 | Average $46,333 |
| Immigrants | Cameroon | 46.4 /100 | #181 | Average $46,329 |
| Swiss | 45.9 /100 | #182 | Average $46,315 |
| French | 45.2 /100 | #183 | Average $46,296 |
| Immigrants | Kenya | 42.4 /100 | #184 | Average $46,214 |
| Uruguayans | 41.6 /100 | #185 | Average $46,190 |
| Vietnamese | 40.9 /100 | #186 | Average $46,172 |
| Iraqis | 39.9 /100 | #187 | Fair $46,140 |