Immigrants from Germany vs Mongolian In Labor Force | Age 35-44
COMPARE
Immigrants from Germany
Mongolian
In Labor Force | Age 35-44
In Labor Force | Age 35-44 Comparison
Immigrants from Germany
Mongolians
83.9%
IN LABOR FORCE | AGE 35-44
2.8/ 100
METRIC RATING
233rd/ 347
METRIC RANK
84.8%
IN LABOR FORCE | AGE 35-44
96.8/ 100
METRIC RATING
94th/ 347
METRIC RANK
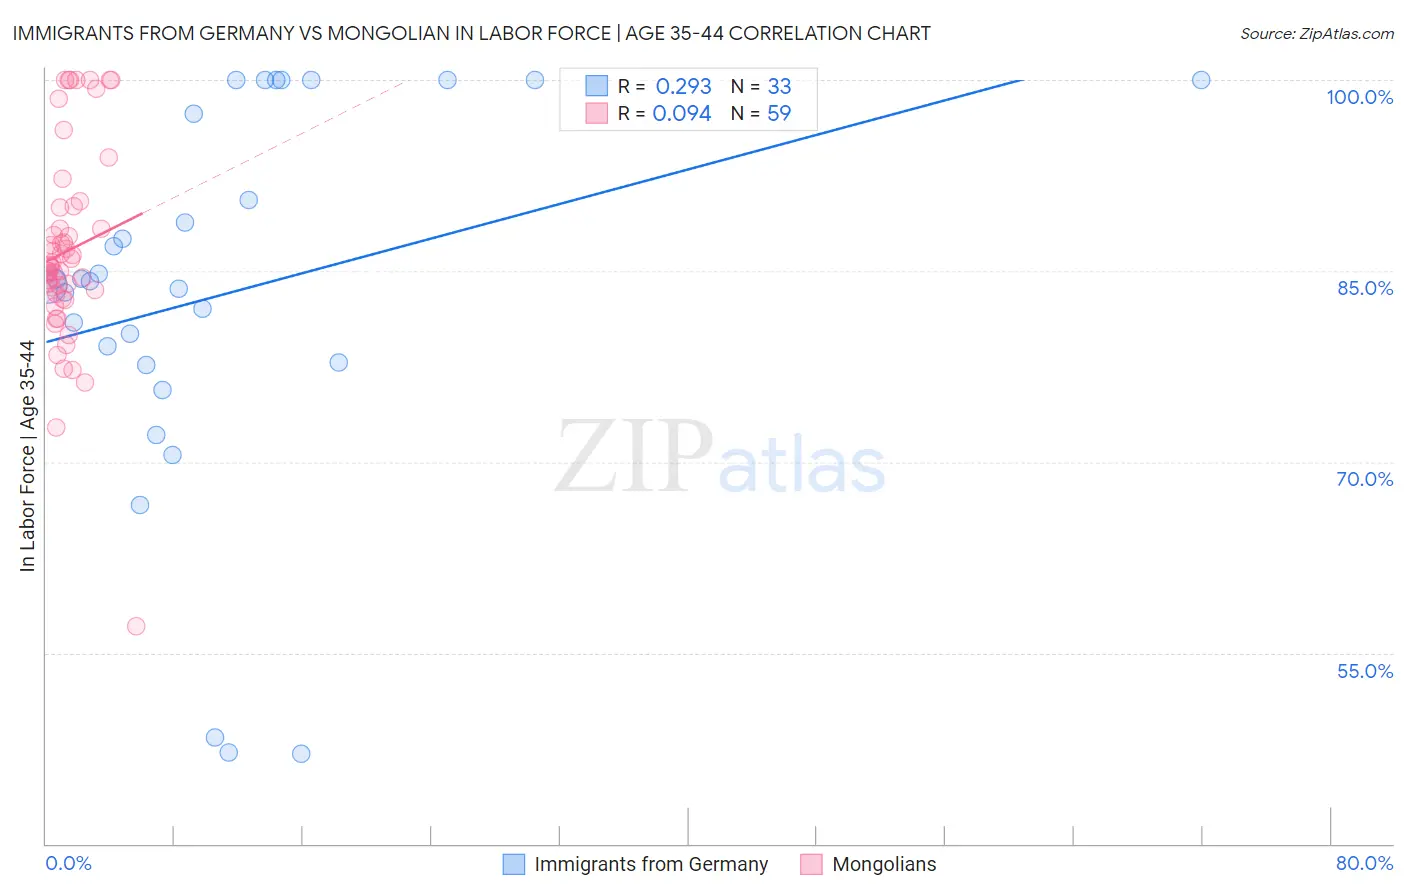
Immigrants from Germany vs Mongolian In Labor Force | Age 35-44 Correlation Chart
The statistical analysis conducted on geographies consisting of 463,742,889 people shows a weak positive correlation between the proportion of Immigrants from Germany and labor force participation rate among population between the ages 35 and 44 in the United States with a correlation coefficient (R) of 0.293 and weighted average of 83.9%. Similarly, the statistical analysis conducted on geographies consisting of 140,321,918 people shows a slight positive correlation between the proportion of Mongolians and labor force participation rate among population between the ages 35 and 44 in the United States with a correlation coefficient (R) of 0.094 and weighted average of 84.8%, a difference of 1.1%.
In Labor Force | Age 35-44 Correlation Summary
| Measurement | Immigrants from Germany | Mongolian |
| Minimum | 47.1% | 57.1% |
| Maximum | 100.0% | 100.0% |
| Range | 52.9% | 42.9% |
| Mean | 83.2% | 86.6% |
| Median | 84.2% | 85.4% |
| Interquartile 25% (IQ1) | 77.7% | 83.2% |
| Interquartile 75% (IQ3) | 98.7% | 89.9% |
| Interquartile Range (IQR) | 21.0% | 6.8% |
| Standard Deviation (Sample) | 14.9% | 7.8% |
| Standard Deviation (Population) | 14.7% | 7.7% |
Similar Demographics by In Labor Force | Age 35-44
Demographics Similar to Immigrants from Germany by In Labor Force | Age 35-44
In terms of in labor force | age 35-44, the demographic groups most similar to Immigrants from Germany are Native Hawaiian (83.9%, a difference of 0.010%), Immigrants from Oceania (83.9%, a difference of 0.010%), Scottish (83.9%, a difference of 0.020%), Immigrants from Syria (83.9%, a difference of 0.020%), and West Indian (83.9%, a difference of 0.030%).
| Demographics | Rating | Rank | In Labor Force | Age 35-44 |
| Panamanians | 5.4 /100 | #226 | Tragic 84.0% |
| British West Indians | 5.3 /100 | #227 | Tragic 84.0% |
| Welsh | 5.3 /100 | #228 | Tragic 84.0% |
| Immigrants | Thailand | 4.7 /100 | #229 | Tragic 84.0% |
| Immigrants | Iraq | 3.7 /100 | #230 | Tragic 83.9% |
| Scottish | 3.2 /100 | #231 | Tragic 83.9% |
| Native Hawaiians | 3.0 /100 | #232 | Tragic 83.9% |
| Immigrants | Germany | 2.8 /100 | #233 | Tragic 83.9% |
| Immigrants | Oceania | 2.6 /100 | #234 | Tragic 83.9% |
| Immigrants | Syria | 2.5 /100 | #235 | Tragic 83.9% |
| West Indians | 2.4 /100 | #236 | Tragic 83.9% |
| English | 1.8 /100 | #237 | Tragic 83.8% |
| Immigrants | Laos | 1.7 /100 | #238 | Tragic 83.8% |
| Celtics | 1.4 /100 | #239 | Tragic 83.8% |
| Arabs | 1.3 /100 | #240 | Tragic 83.8% |
Demographics Similar to Mongolians by In Labor Force | Age 35-44
In terms of in labor force | age 35-44, the demographic groups most similar to Mongolians are Immigrants from Kuwait (84.8%, a difference of 0.010%), Cuban (84.8%, a difference of 0.010%), Egyptian (84.8%, a difference of 0.010%), Immigrants from Europe (84.9%, a difference of 0.020%), and Ghanaian (84.8%, a difference of 0.020%).
| Demographics | Rating | Rank | In Labor Force | Age 35-44 |
| Belgians | 97.7 /100 | #87 | Exceptional 84.9% |
| Yugoslavians | 97.7 /100 | #88 | Exceptional 84.9% |
| Immigrants | Pakistan | 97.5 /100 | #89 | Exceptional 84.9% |
| Immigrants | France | 97.4 /100 | #90 | Exceptional 84.9% |
| Immigrants | Europe | 97.2 /100 | #91 | Exceptional 84.9% |
| Ghanaians | 97.2 /100 | #92 | Exceptional 84.8% |
| Immigrants | Northern Africa | 97.1 /100 | #93 | Exceptional 84.8% |
| Mongolians | 96.8 /100 | #94 | Exceptional 84.8% |
| Immigrants | Kuwait | 96.7 /100 | #95 | Exceptional 84.8% |
| Cubans | 96.6 /100 | #96 | Exceptional 84.8% |
| Egyptians | 96.6 /100 | #97 | Exceptional 84.8% |
| Indians (Asian) | 96.1 /100 | #98 | Exceptional 84.8% |
| Haitians | 96.0 /100 | #99 | Exceptional 84.8% |
| Immigrants | Czechoslovakia | 95.9 /100 | #100 | Exceptional 84.8% |
| Immigrants | Australia | 95.5 /100 | #101 | Exceptional 84.8% |