Immigrants from Serbia vs Filipino Wage/Income Gap
COMPARE
Immigrants from Serbia
Filipino
Wage/Income Gap
Wage/Income Gap Comparison
Immigrants from Serbia
Filipinos
26.0%
WAGE/INCOME GAP
35.4/ 100
METRIC RATING
182nd/ 347
METRIC RANK
29.7%
WAGE/INCOME GAP
0.0/ 100
METRIC RATING
338th/ 347
METRIC RANK
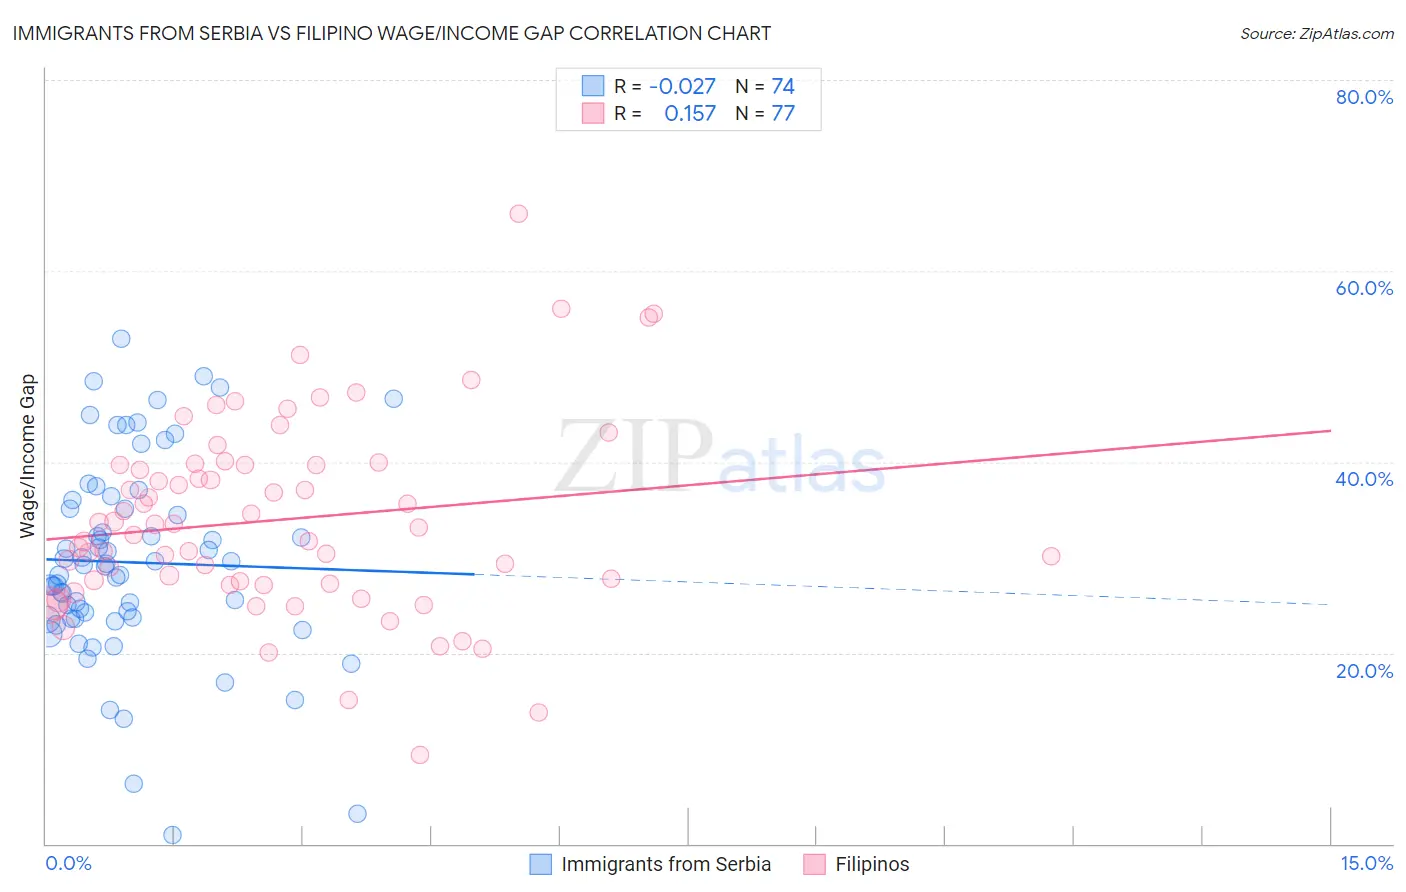
Immigrants from Serbia vs Filipino Wage/Income Gap Correlation Chart
The statistical analysis conducted on geographies consisting of 131,718,439 people shows no correlation between the proportion of Immigrants from Serbia and wage/income gap percentage in the United States with a correlation coefficient (R) of -0.027 and weighted average of 26.0%. Similarly, the statistical analysis conducted on geographies consisting of 254,305,942 people shows a poor positive correlation between the proportion of Filipinos and wage/income gap percentage in the United States with a correlation coefficient (R) of 0.157 and weighted average of 29.7%, a difference of 14.1%.
Wage/Income Gap Correlation Summary
| Measurement | Immigrants from Serbia | Filipino |
| Minimum | 0.97% | 9.3% |
| Maximum | 52.9% | 66.0% |
| Range | 51.9% | 56.7% |
| Mean | 29.5% | 33.9% |
| Median | 29.1% | 33.2% |
| Interquartile 25% (IQ1) | 23.6% | 27.2% |
| Interquartile 75% (IQ3) | 35.1% | 39.7% |
| Interquartile Range (IQR) | 11.5% | 12.5% |
| Standard Deviation (Sample) | 10.4% | 10.1% |
| Standard Deviation (Population) | 10.3% | 10.1% |
Similar Demographics by Wage/Income Gap
Demographics Similar to Immigrants from Serbia by Wage/Income Gap
In terms of wage/income gap, the demographic groups most similar to Immigrants from Serbia are Immigrants from Kazakhstan (26.0%, a difference of 0.010%), Immigrants from Bolivia (26.0%, a difference of 0.070%), Mexican (26.0%, a difference of 0.070%), Pakistani (26.1%, a difference of 0.12%), and Guamanian/Chamorro (26.0%, a difference of 0.19%).
| Demographics | Rating | Rank | Wage/Income Gap |
| Sri Lankans | 47.0 /100 | #175 | Average 25.8% |
| Paraguayans | 46.7 /100 | #176 | Average 25.8% |
| Cambodians | 45.1 /100 | #177 | Average 25.8% |
| Chinese | 42.0 /100 | #178 | Average 25.9% |
| Samoans | 38.6 /100 | #179 | Fair 26.0% |
| Guamanians/Chamorros | 38.0 /100 | #180 | Fair 26.0% |
| Immigrants | Bolivia | 36.4 /100 | #181 | Fair 26.0% |
| Immigrants | Serbia | 35.4 /100 | #182 | Fair 26.0% |
| Immigrants | Kazakhstan | 35.2 /100 | #183 | Fair 26.0% |
| Mexicans | 34.4 /100 | #184 | Fair 26.0% |
| Pakistanis | 33.7 /100 | #185 | Fair 26.1% |
| Immigrants | Indonesia | 32.5 /100 | #186 | Fair 26.1% |
| Palestinians | 29.9 /100 | #187 | Fair 26.1% |
| Immigrants | Egypt | 29.9 /100 | #188 | Fair 26.1% |
| Immigrants | Moldova | 26.6 /100 | #189 | Fair 26.2% |
Demographics Similar to Filipinos by Wage/Income Gap
In terms of wage/income gap, the demographic groups most similar to Filipinos are Iranian (29.7%, a difference of 0.060%), Dutch (29.6%, a difference of 0.22%), English (29.5%, a difference of 0.80%), Immigrants from Taiwan (29.5%, a difference of 0.81%), and Swiss (30.0%, a difference of 0.89%).
| Demographics | Rating | Rank | Wage/Income Gap |
| Czechs | 0.0 /100 | #331 | Tragic 29.2% |
| Immigrants | South Central Asia | 0.0 /100 | #332 | Tragic 29.3% |
| Europeans | 0.0 /100 | #333 | Tragic 29.4% |
| Swedes | 0.0 /100 | #334 | Tragic 29.4% |
| Immigrants | Taiwan | 0.0 /100 | #335 | Tragic 29.5% |
| English | 0.0 /100 | #336 | Tragic 29.5% |
| Dutch | 0.0 /100 | #337 | Tragic 29.6% |
| Filipinos | 0.0 /100 | #338 | Tragic 29.7% |
| Iranians | 0.0 /100 | #339 | Tragic 29.7% |
| Swiss | 0.0 /100 | #340 | Tragic 30.0% |
| Thais | 0.0 /100 | #341 | Tragic 30.5% |
| Pennsylvania Germans | 0.0 /100 | #342 | Tragic 30.7% |
| Danes | 0.0 /100 | #343 | Tragic 31.0% |
| Assyrians/Chaldeans/Syriacs | 0.0 /100 | #344 | Tragic 31.0% |
| Immigrants | India | 0.0 /100 | #345 | Tragic 31.5% |