Sudanese vs Filipino Wage/Income Gap
COMPARE
Sudanese
Filipino
Wage/Income Gap
Wage/Income Gap Comparison
Sudanese
Filipinos
24.0%
WAGE/INCOME GAP
98.6/ 100
METRIC RATING
106th/ 347
METRIC RANK
29.7%
WAGE/INCOME GAP
0.0/ 100
METRIC RATING
338th/ 347
METRIC RANK
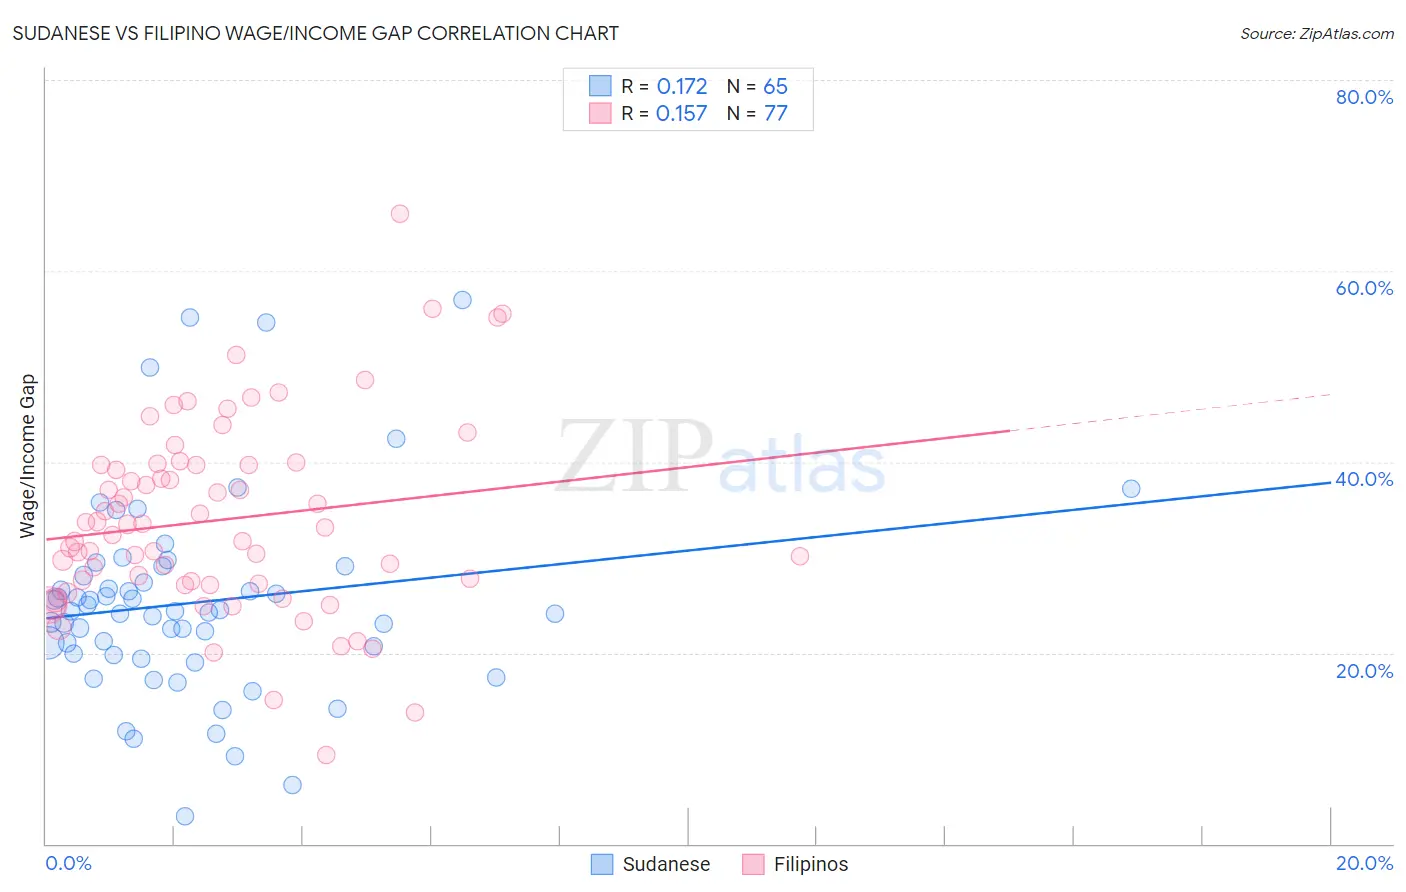
Sudanese vs Filipino Wage/Income Gap Correlation Chart
The statistical analysis conducted on geographies consisting of 110,137,657 people shows a poor positive correlation between the proportion of Sudanese and wage/income gap percentage in the United States with a correlation coefficient (R) of 0.172 and weighted average of 24.0%. Similarly, the statistical analysis conducted on geographies consisting of 254,305,942 people shows a poor positive correlation between the proportion of Filipinos and wage/income gap percentage in the United States with a correlation coefficient (R) of 0.157 and weighted average of 29.7%, a difference of 23.9%.
Wage/Income Gap Correlation Summary
| Measurement | Sudanese | Filipino |
| Minimum | 2.9% | 9.3% |
| Maximum | 56.9% | 66.0% |
| Range | 54.1% | 56.7% |
| Mean | 25.2% | 33.9% |
| Median | 24.4% | 33.2% |
| Interquartile 25% (IQ1) | 19.8% | 27.2% |
| Interquartile 75% (IQ3) | 28.6% | 39.7% |
| Interquartile Range (IQR) | 8.8% | 12.5% |
| Standard Deviation (Sample) | 10.4% | 10.1% |
| Standard Deviation (Population) | 10.3% | 10.1% |
Similar Demographics by Wage/Income Gap
Demographics Similar to Sudanese by Wage/Income Gap
In terms of wage/income gap, the demographic groups most similar to Sudanese are Moroccan (24.0%, a difference of 0.0%), Tlingit-Haida (24.0%, a difference of 0.060%), Yaqui (24.0%, a difference of 0.30%), Immigrants from Albania (24.0%, a difference of 0.31%), and Ugandan (24.1%, a difference of 0.36%).
| Demographics | Rating | Rank | Wage/Income Gap |
| Aleuts | 99.2 /100 | #99 | Exceptional 23.7% |
| Yakama | 99.2 /100 | #100 | Exceptional 23.7% |
| Japanese | 99.1 /100 | #101 | Exceptional 23.8% |
| Immigrants | Laos | 99.0 /100 | #102 | Exceptional 23.8% |
| Tsimshian | 98.9 /100 | #103 | Exceptional 23.9% |
| Tlingit-Haida | 98.7 /100 | #104 | Exceptional 24.0% |
| Moroccans | 98.6 /100 | #105 | Exceptional 24.0% |
| Sudanese | 98.6 /100 | #106 | Exceptional 24.0% |
| Yaqui | 98.4 /100 | #107 | Exceptional 24.0% |
| Immigrants | Albania | 98.4 /100 | #108 | Exceptional 24.0% |
| Ugandans | 98.3 /100 | #109 | Exceptional 24.1% |
| Immigrants | Morocco | 98.1 /100 | #110 | Exceptional 24.1% |
| Soviet Union | 97.6 /100 | #111 | Exceptional 24.2% |
| Immigrants | Colombia | 97.0 /100 | #112 | Exceptional 24.3% |
| Sioux | 96.9 /100 | #113 | Exceptional 24.3% |
Demographics Similar to Filipinos by Wage/Income Gap
In terms of wage/income gap, the demographic groups most similar to Filipinos are Iranian (29.7%, a difference of 0.060%), Dutch (29.6%, a difference of 0.22%), English (29.5%, a difference of 0.80%), Immigrants from Taiwan (29.5%, a difference of 0.81%), and Swiss (30.0%, a difference of 0.89%).
| Demographics | Rating | Rank | Wage/Income Gap |
| Czechs | 0.0 /100 | #331 | Tragic 29.2% |
| Immigrants | South Central Asia | 0.0 /100 | #332 | Tragic 29.3% |
| Europeans | 0.0 /100 | #333 | Tragic 29.4% |
| Swedes | 0.0 /100 | #334 | Tragic 29.4% |
| Immigrants | Taiwan | 0.0 /100 | #335 | Tragic 29.5% |
| English | 0.0 /100 | #336 | Tragic 29.5% |
| Dutch | 0.0 /100 | #337 | Tragic 29.6% |
| Filipinos | 0.0 /100 | #338 | Tragic 29.7% |
| Iranians | 0.0 /100 | #339 | Tragic 29.7% |
| Swiss | 0.0 /100 | #340 | Tragic 30.0% |
| Thais | 0.0 /100 | #341 | Tragic 30.5% |
| Pennsylvania Germans | 0.0 /100 | #342 | Tragic 30.7% |
| Danes | 0.0 /100 | #343 | Tragic 31.0% |
| Assyrians/Chaldeans/Syriacs | 0.0 /100 | #344 | Tragic 31.0% |
| Immigrants | India | 0.0 /100 | #345 | Tragic 31.5% |