Immigrants from El Salvador vs Salvadoran Wage/Income Gap
COMPARE
Immigrants from El Salvador
Salvadoran
Wage/Income Gap
Wage/Income Gap Comparison
Immigrants from El Salvador
Salvadorans
22.8%
WAGE/INCOME GAP
99.9/ 100
METRIC RATING
71st/ 347
METRIC RANK
23.0%
WAGE/INCOME GAP
99.9/ 100
METRIC RATING
80th/ 347
METRIC RANK
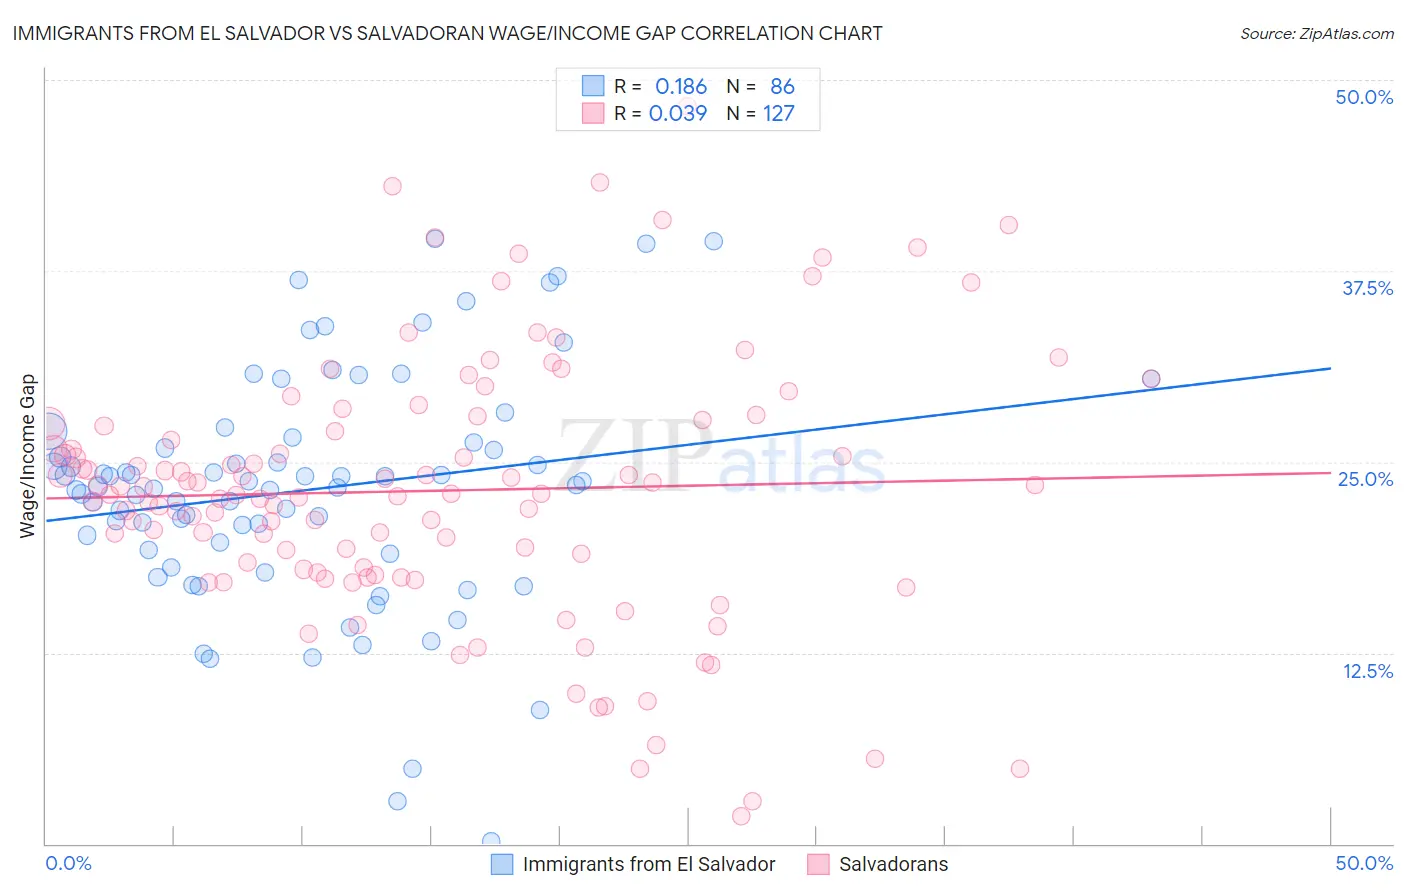
Immigrants from El Salvador vs Salvadoran Wage/Income Gap Correlation Chart
The statistical analysis conducted on geographies consisting of 357,610,247 people shows a poor positive correlation between the proportion of Immigrants from El Salvador and wage/income gap percentage in the United States with a correlation coefficient (R) of 0.186 and weighted average of 22.8%. Similarly, the statistical analysis conducted on geographies consisting of 398,802,169 people shows no correlation between the proportion of Salvadorans and wage/income gap percentage in the United States with a correlation coefficient (R) of 0.039 and weighted average of 23.0%, a difference of 0.95%.
Wage/Income Gap Correlation Summary
| Measurement | Immigrants from El Salvador | Salvadoran |
| Minimum | 0.18% | 1.8% |
| Maximum | 39.6% | 48.2% |
| Range | 39.4% | 46.5% |
| Mean | 23.2% | 23.1% |
| Median | 23.4% | 22.9% |
| Interquartile 25% (IQ1) | 19.2% | 18.0% |
| Interquartile 75% (IQ3) | 26.3% | 27.5% |
| Interquartile Range (IQR) | 7.1% | 9.5% |
| Standard Deviation (Sample) | 7.7% | 8.6% |
| Standard Deviation (Population) | 7.7% | 8.6% |
Demographics Similar to Immigrants from El Salvador and Salvadorans by Wage/Income Gap
In terms of wage/income gap, the demographic groups most similar to Immigrants from El Salvador are Subsaharan African (22.8%, a difference of 0.15%), Immigrants from Uzbekistan (22.7%, a difference of 0.17%), Immigrants from Eastern Africa (22.8%, a difference of 0.18%), Immigrants from Burma/Myanmar (22.8%, a difference of 0.26%), and Indonesian (22.7%, a difference of 0.28%). Similarly, the demographic groups most similar to Salvadorans are Immigrants from Nicaragua (23.0%, a difference of 0.070%), Nigerian (23.0%, a difference of 0.15%), African (22.9%, a difference of 0.26%), Ecuadorian (22.9%, a difference of 0.39%), and Fijian (22.9%, a difference of 0.41%).
| Demographics | Rating | Rank | Wage/Income Gap |
| Guatemalans | 99.9 /100 | #65 | Exceptional 22.6% |
| Central American Indians | 99.9 /100 | #66 | Exceptional 22.7% |
| Menominee | 99.9 /100 | #67 | Exceptional 22.7% |
| Immigrants | Nigeria | 99.9 /100 | #68 | Exceptional 22.7% |
| Indonesians | 99.9 /100 | #69 | Exceptional 22.7% |
| Immigrants | Uzbekistan | 99.9 /100 | #70 | Exceptional 22.7% |
| Immigrants | El Salvador | 99.9 /100 | #71 | Exceptional 22.8% |
| Sub-Saharan Africans | 99.9 /100 | #72 | Exceptional 22.8% |
| Immigrants | Eastern Africa | 99.9 /100 | #73 | Exceptional 22.8% |
| Immigrants | Burma/Myanmar | 99.9 /100 | #74 | Exceptional 22.8% |
| Fijians | 99.9 /100 | #75 | Exceptional 22.9% |
| Ecuadorians | 99.9 /100 | #76 | Exceptional 22.9% |
| Africans | 99.9 /100 | #77 | Exceptional 22.9% |
| Nigerians | 99.9 /100 | #78 | Exceptional 23.0% |
| Immigrants | Nicaragua | 99.9 /100 | #79 | Exceptional 23.0% |
| Salvadorans | 99.9 /100 | #80 | Exceptional 23.0% |
| Bermudans | 99.8 /100 | #81 | Exceptional 23.1% |
| Central Americans | 99.8 /100 | #82 | Exceptional 23.1% |
| Immigrants | Africa | 99.8 /100 | #83 | Exceptional 23.2% |
| Cubans | 99.7 /100 | #84 | Exceptional 23.3% |
| Immigrants | Cambodia | 99.7 /100 | #85 | Exceptional 23.3% |