Immigrants from China vs Cambodian Wage/Income Gap
COMPARE
Immigrants from China
Cambodian
Wage/Income Gap
Wage/Income Gap Comparison
Immigrants from China
Cambodians
26.7%
WAGE/INCOME GAP
10.3/ 100
METRIC RATING
214th/ 347
METRIC RANK
25.8%
WAGE/INCOME GAP
45.1/ 100
METRIC RATING
177th/ 347
METRIC RANK
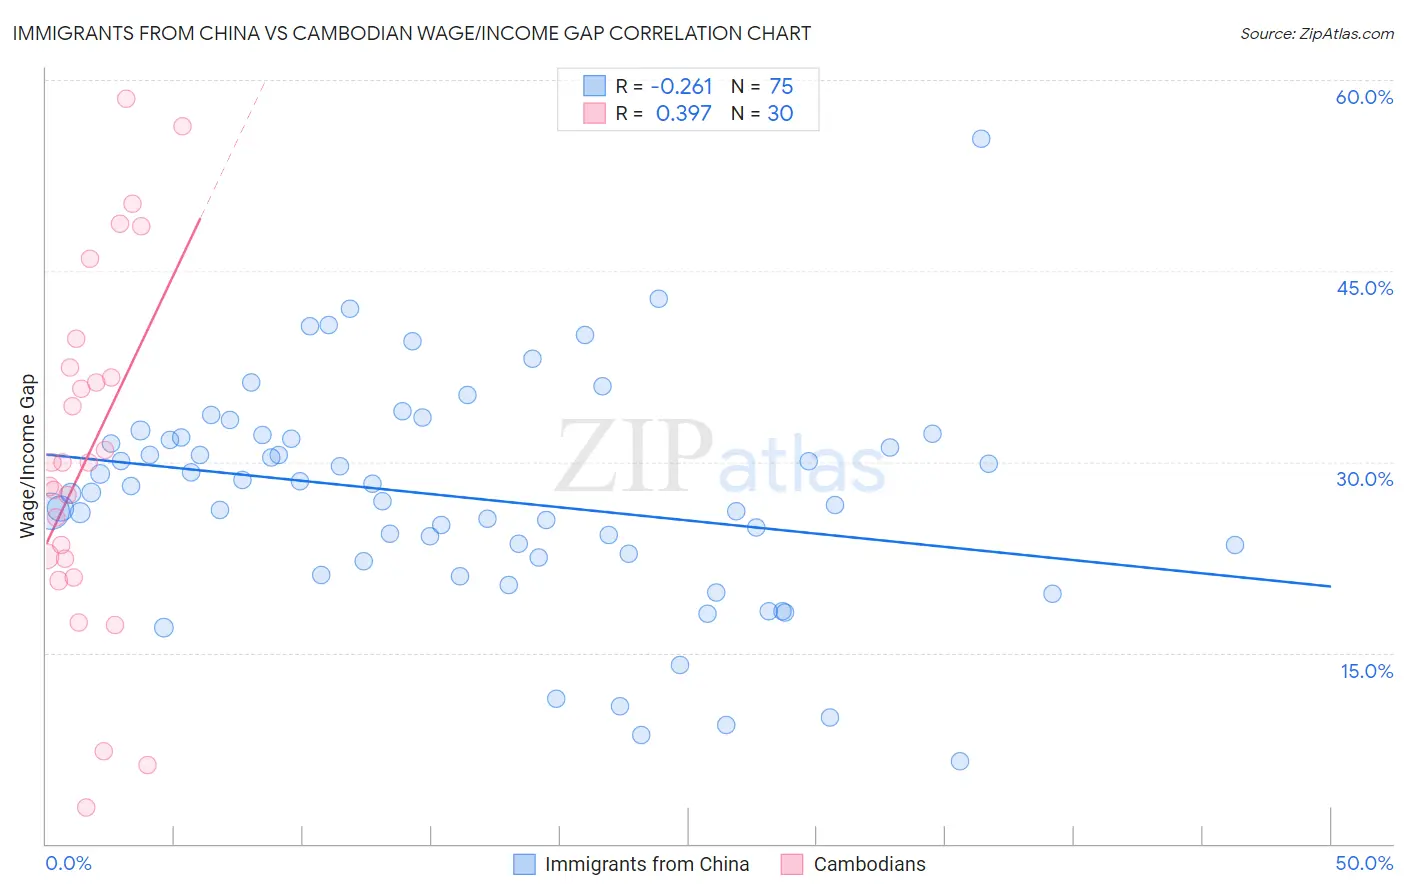
Immigrants from China vs Cambodian Wage/Income Gap Correlation Chart
The statistical analysis conducted on geographies consisting of 456,702,733 people shows a weak negative correlation between the proportion of Immigrants from China and wage/income gap percentage in the United States with a correlation coefficient (R) of -0.261 and weighted average of 26.7%. Similarly, the statistical analysis conducted on geographies consisting of 102,500,825 people shows a mild positive correlation between the proportion of Cambodians and wage/income gap percentage in the United States with a correlation coefficient (R) of 0.397 and weighted average of 25.8%, a difference of 3.2%.
Wage/Income Gap Correlation Summary
| Measurement | Immigrants from China | Cambodian |
| Minimum | 6.5% | 2.9% |
| Maximum | 55.3% | 58.5% |
| Range | 48.9% | 55.6% |
| Mean | 27.2% | 30.6% |
| Median | 27.6% | 29.9% |
| Interquartile 25% (IQ1) | 22.4% | 22.4% |
| Interquartile 75% (IQ3) | 31.9% | 37.4% |
| Interquartile Range (IQR) | 9.5% | 15.0% |
| Standard Deviation (Sample) | 8.7% | 13.9% |
| Standard Deviation (Population) | 8.6% | 13.7% |
Similar Demographics by Wage/Income Gap
Demographics Similar to Immigrants from China by Wage/Income Gap
In terms of wage/income gap, the demographic groups most similar to Immigrants from China are Immigrants from Iraq (26.7%, a difference of 0.010%), Yugoslavian (26.7%, a difference of 0.090%), Immigrants from Portugal (26.7%, a difference of 0.13%), Iraqi (26.6%, a difference of 0.16%), and Mongolian (26.6%, a difference of 0.19%).
| Demographics | Rating | Rank | Wage/Income Gap |
| Immigrants | Italy | 15.8 /100 | #207 | Poor 26.5% |
| Egyptians | 12.7 /100 | #208 | Poor 26.6% |
| Immigrants | Kuwait | 12.6 /100 | #209 | Poor 26.6% |
| Arabs | 12.3 /100 | #210 | Poor 26.6% |
| Mongolians | 11.4 /100 | #211 | Poor 26.6% |
| Iraqis | 11.2 /100 | #212 | Poor 26.6% |
| Immigrants | Iraq | 10.3 /100 | #213 | Poor 26.7% |
| Immigrants | China | 10.3 /100 | #214 | Poor 26.7% |
| Yugoslavians | 9.7 /100 | #215 | Tragic 26.7% |
| Immigrants | Portugal | 9.5 /100 | #216 | Tragic 26.7% |
| Brazilians | 9.2 /100 | #217 | Tragic 26.7% |
| Immigrants | Saudi Arabia | 9.1 /100 | #218 | Tragic 26.7% |
| Immigrants | Poland | 8.9 /100 | #219 | Tragic 26.7% |
| Immigrants | Latvia | 8.9 /100 | #220 | Tragic 26.7% |
| Immigrants | Spain | 8.5 /100 | #221 | Tragic 26.8% |
Demographics Similar to Cambodians by Wage/Income Gap
In terms of wage/income gap, the demographic groups most similar to Cambodians are Paraguayan (25.8%, a difference of 0.11%), Sri Lankan (25.8%, a difference of 0.12%), Chinese (25.9%, a difference of 0.21%), Alaskan Athabascan (25.8%, a difference of 0.32%), and Samoan (26.0%, a difference of 0.44%).
| Demographics | Rating | Rank | Wage/Income Gap |
| Immigrants | Oceania | 57.5 /100 | #170 | Average 25.6% |
| Immigrants | Greece | 56.6 /100 | #171 | Average 25.7% |
| Immigrants | Chile | 53.2 /100 | #172 | Average 25.7% |
| Immigrants | Belarus | 52.9 /100 | #173 | Average 25.7% |
| Alaskan Athabascans | 50.0 /100 | #174 | Average 25.8% |
| Sri Lankans | 47.0 /100 | #175 | Average 25.8% |
| Paraguayans | 46.7 /100 | #176 | Average 25.8% |
| Cambodians | 45.1 /100 | #177 | Average 25.8% |
| Chinese | 42.0 /100 | #178 | Average 25.9% |
| Samoans | 38.6 /100 | #179 | Fair 26.0% |
| Guamanians/Chamorros | 38.0 /100 | #180 | Fair 26.0% |
| Immigrants | Bolivia | 36.4 /100 | #181 | Fair 26.0% |
| Immigrants | Serbia | 35.4 /100 | #182 | Fair 26.0% |
| Immigrants | Kazakhstan | 35.2 /100 | #183 | Fair 26.0% |
| Mexicans | 34.4 /100 | #184 | Fair 26.0% |