Immigrants from China vs Immigrants from Croatia Wage/Income Gap
COMPARE
Immigrants from China
Immigrants from Croatia
Wage/Income Gap
Wage/Income Gap Comparison
Immigrants from China
Immigrants from Croatia
26.7%
WAGE/INCOME GAP
10.3/ 100
METRIC RATING
214th/ 347
METRIC RANK
26.2%
WAGE/INCOME GAP
24.8/ 100
METRIC RATING
190th/ 347
METRIC RANK
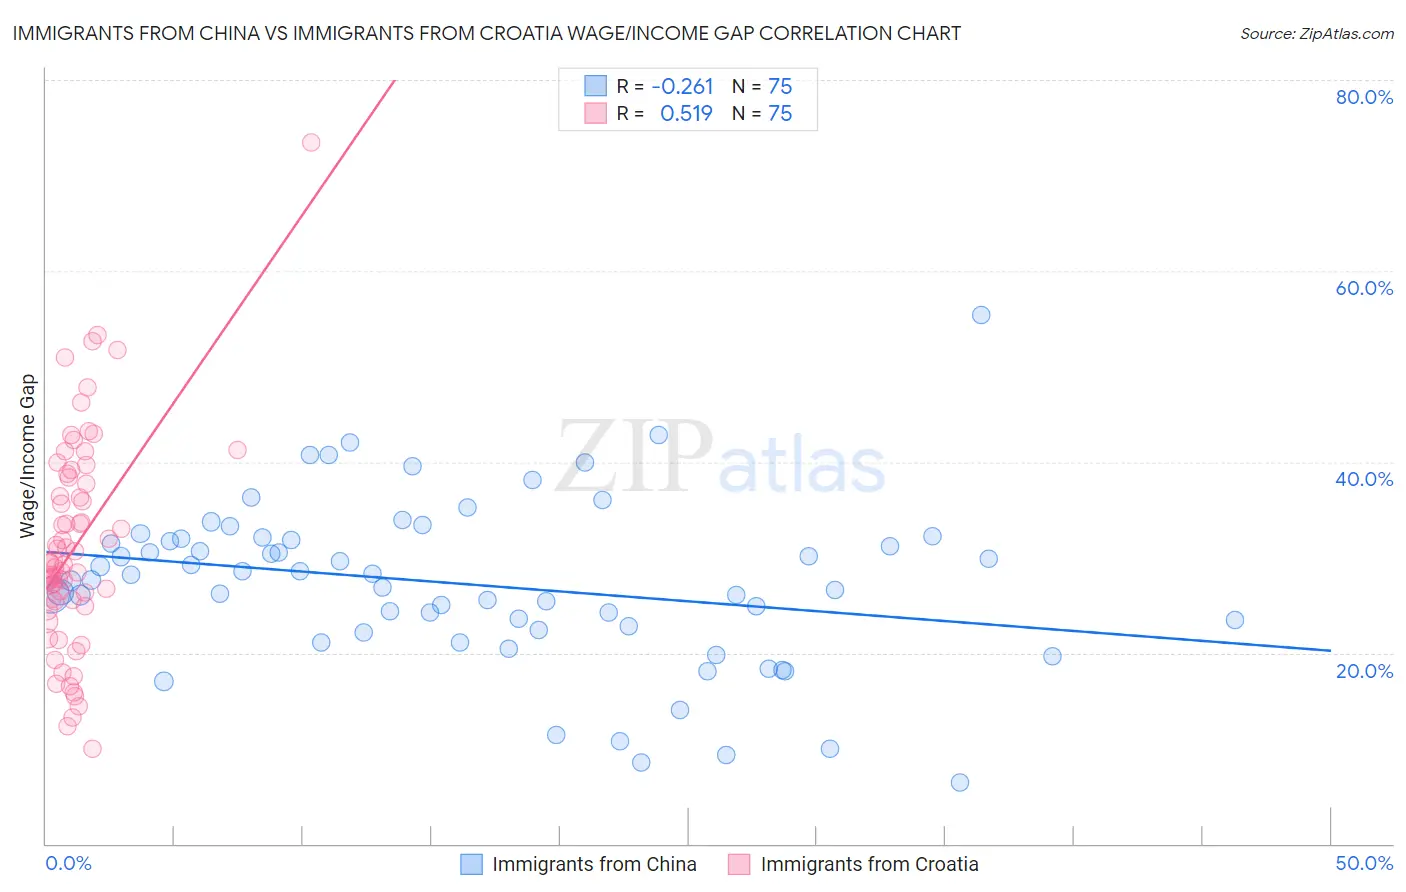
Immigrants from China vs Immigrants from Croatia Wage/Income Gap Correlation Chart
The statistical analysis conducted on geographies consisting of 456,702,733 people shows a weak negative correlation between the proportion of Immigrants from China and wage/income gap percentage in the United States with a correlation coefficient (R) of -0.261 and weighted average of 26.7%. Similarly, the statistical analysis conducted on geographies consisting of 132,560,364 people shows a substantial positive correlation between the proportion of Immigrants from Croatia and wage/income gap percentage in the United States with a correlation coefficient (R) of 0.519 and weighted average of 26.2%, a difference of 1.7%.
Wage/Income Gap Correlation Summary
| Measurement | Immigrants from China | Immigrants from Croatia |
| Minimum | 6.5% | 10.0% |
| Maximum | 55.3% | 73.5% |
| Range | 48.9% | 63.5% |
| Mean | 27.2% | 31.2% |
| Median | 27.6% | 29.4% |
| Interquartile 25% (IQ1) | 22.4% | 25.4% |
| Interquartile 75% (IQ3) | 31.9% | 38.4% |
| Interquartile Range (IQR) | 9.5% | 13.0% |
| Standard Deviation (Sample) | 8.7% | 11.1% |
| Standard Deviation (Population) | 8.6% | 11.0% |
Similar Demographics by Wage/Income Gap
Demographics Similar to Immigrants from China by Wage/Income Gap
In terms of wage/income gap, the demographic groups most similar to Immigrants from China are Immigrants from Iraq (26.7%, a difference of 0.010%), Yugoslavian (26.7%, a difference of 0.090%), Immigrants from Portugal (26.7%, a difference of 0.13%), Iraqi (26.6%, a difference of 0.16%), and Mongolian (26.6%, a difference of 0.19%).
| Demographics | Rating | Rank | Wage/Income Gap |
| Immigrants | Italy | 15.8 /100 | #207 | Poor 26.5% |
| Egyptians | 12.7 /100 | #208 | Poor 26.6% |
| Immigrants | Kuwait | 12.6 /100 | #209 | Poor 26.6% |
| Arabs | 12.3 /100 | #210 | Poor 26.6% |
| Mongolians | 11.4 /100 | #211 | Poor 26.6% |
| Iraqis | 11.2 /100 | #212 | Poor 26.6% |
| Immigrants | Iraq | 10.3 /100 | #213 | Poor 26.7% |
| Immigrants | China | 10.3 /100 | #214 | Poor 26.7% |
| Yugoslavians | 9.7 /100 | #215 | Tragic 26.7% |
| Immigrants | Portugal | 9.5 /100 | #216 | Tragic 26.7% |
| Brazilians | 9.2 /100 | #217 | Tragic 26.7% |
| Immigrants | Saudi Arabia | 9.1 /100 | #218 | Tragic 26.7% |
| Immigrants | Poland | 8.9 /100 | #219 | Tragic 26.7% |
| Immigrants | Latvia | 8.9 /100 | #220 | Tragic 26.7% |
| Immigrants | Spain | 8.5 /100 | #221 | Tragic 26.8% |
Demographics Similar to Immigrants from Croatia by Wage/Income Gap
In terms of wage/income gap, the demographic groups most similar to Immigrants from Croatia are Immigrants from Venezuela (26.2%, a difference of 0.020%), Immigrants from Moldova (26.2%, a difference of 0.15%), Immigrants from Bulgaria (26.3%, a difference of 0.20%), Immigrants from Jordan (26.3%, a difference of 0.22%), and Chilean (26.3%, a difference of 0.22%).
| Demographics | Rating | Rank | Wage/Income Gap |
| Immigrants | Kazakhstan | 35.2 /100 | #183 | Fair 26.0% |
| Mexicans | 34.4 /100 | #184 | Fair 26.0% |
| Pakistanis | 33.7 /100 | #185 | Fair 26.1% |
| Immigrants | Indonesia | 32.5 /100 | #186 | Fair 26.1% |
| Palestinians | 29.9 /100 | #187 | Fair 26.1% |
| Immigrants | Egypt | 29.9 /100 | #188 | Fair 26.1% |
| Immigrants | Moldova | 26.6 /100 | #189 | Fair 26.2% |
| Immigrants | Croatia | 24.8 /100 | #190 | Fair 26.2% |
| Immigrants | Venezuela | 24.7 /100 | #191 | Fair 26.2% |
| Immigrants | Bulgaria | 22.5 /100 | #192 | Fair 26.3% |
| Immigrants | Jordan | 22.4 /100 | #193 | Fair 26.3% |
| Chileans | 22.3 /100 | #194 | Fair 26.3% |
| Immigrants | Malaysia | 22.2 /100 | #195 | Fair 26.3% |
| Immigrants | Western Asia | 21.7 /100 | #196 | Fair 26.3% |
| Zimbabweans | 21.6 /100 | #197 | Fair 26.3% |