Immigrants from Burma/Myanmar vs Guyanese Median Male Earnings
COMPARE
Immigrants from Burma/Myanmar
Guyanese
Median Male Earnings
Median Male Earnings Comparison
Immigrants from Burma/Myanmar
Guyanese
$50,298
MEDIAN MALE EARNINGS
1.6/ 100
METRIC RATING
249th/ 347
METRIC RANK
$50,613
MEDIAN MALE EARNINGS
2.2/ 100
METRIC RATING
242nd/ 347
METRIC RANK
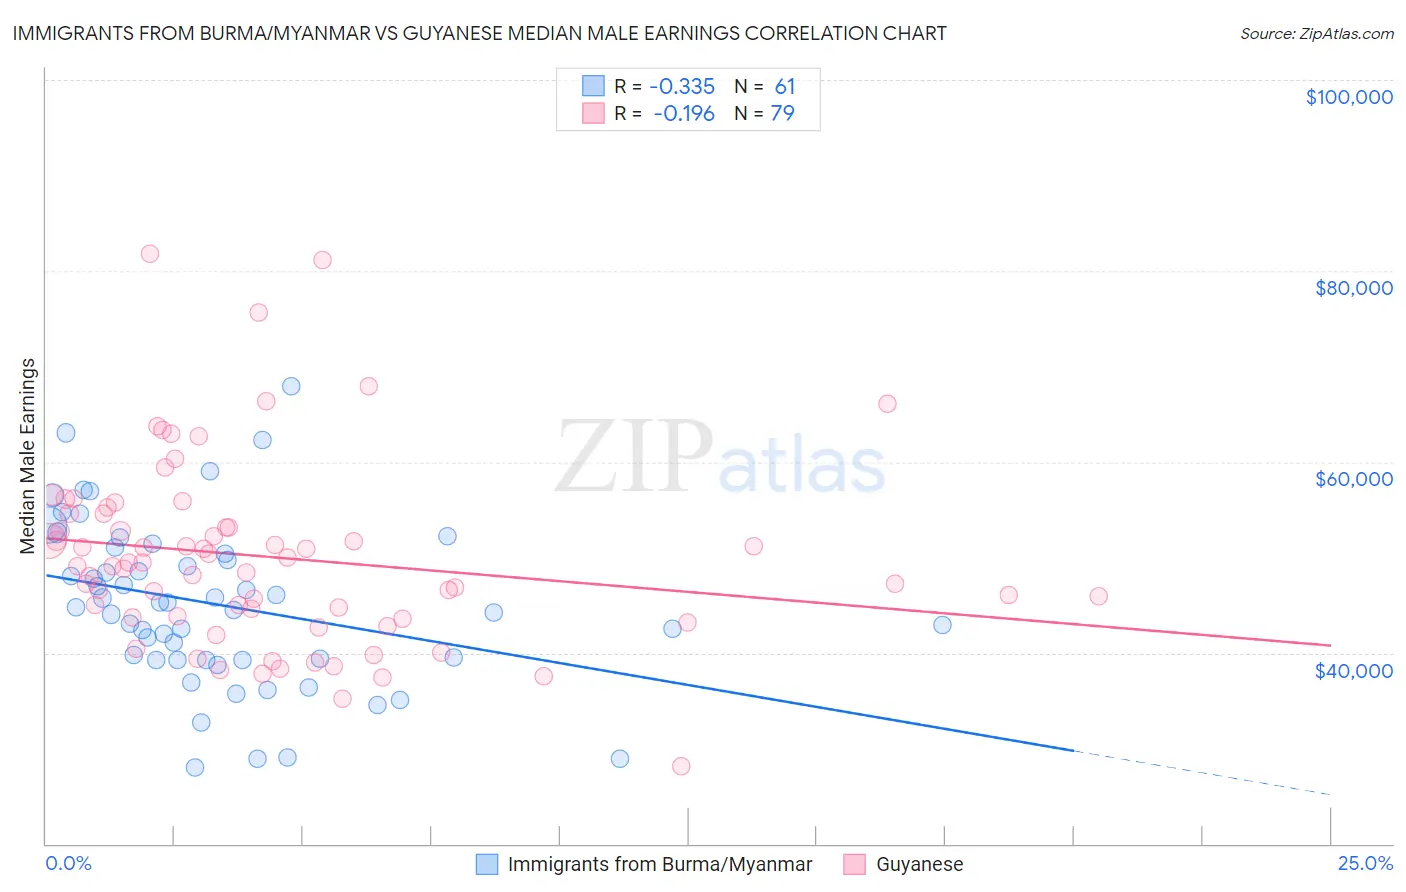
Immigrants from Burma/Myanmar vs Guyanese Median Male Earnings Correlation Chart
The statistical analysis conducted on geographies consisting of 172,350,242 people shows a mild negative correlation between the proportion of Immigrants from Burma/Myanmar and median male earnings in the United States with a correlation coefficient (R) of -0.335 and weighted average of $50,298. Similarly, the statistical analysis conducted on geographies consisting of 176,926,771 people shows a poor negative correlation between the proportion of Guyanese and median male earnings in the United States with a correlation coefficient (R) of -0.196 and weighted average of $50,613, a difference of 0.63%.
Median Male Earnings Correlation Summary
| Measurement | Immigrants from Burma/Myanmar | Guyanese |
| Minimum | $27,990 | $28,099 |
| Maximum | $67,960 | $81,815 |
| Range | $39,970 | $53,716 |
| Mean | $45,043 | $50,024 |
| Median | $44,781 | $49,104 |
| Interquartile 25% (IQ1) | $39,264 | $43,659 |
| Interquartile 75% (IQ3) | $50,701 | $54,533 |
| Interquartile Range (IQR) | $11,437 | $10,874 |
| Standard Deviation (Sample) | $8,603 | $9,787 |
| Standard Deviation (Population) | $8,532 | $9,725 |
Demographics Similar to Immigrants from Burma/Myanmar and Guyanese by Median Male Earnings
In terms of median male earnings, the demographic groups most similar to Immigrants from Burma/Myanmar are Osage ($50,292, a difference of 0.010%), Immigrants from Grenada ($50,279, a difference of 0.040%), Immigrants from Guyana ($50,321, a difference of 0.050%), Subsaharan African ($50,408, a difference of 0.22%), and Immigrants from Ecuador ($50,474, a difference of 0.35%). Similarly, the demographic groups most similar to Guyanese are French American Indian ($50,611, a difference of 0.0%), Immigrants from St. Vincent and the Grenadines ($50,665, a difference of 0.10%), Houma ($50,547, a difference of 0.13%), West Indian ($50,682, a difference of 0.14%), and Hawaiian ($50,488, a difference of 0.25%).
| Demographics | Rating | Rank | Median Male Earnings |
| Immigrants | Western Africa | 3.0 /100 | #235 | Tragic $50,940 |
| Pennsylvania Germans | 2.8 /100 | #236 | Tragic $50,878 |
| Immigrants | Barbados | 2.6 /100 | #237 | Tragic $50,795 |
| Malaysians | 2.5 /100 | #238 | Tragic $50,772 |
| Americans | 2.5 /100 | #239 | Tragic $50,761 |
| West Indians | 2.3 /100 | #240 | Tragic $50,682 |
| Immigrants | St. Vincent and the Grenadines | 2.3 /100 | #241 | Tragic $50,665 |
| Guyanese | 2.2 /100 | #242 | Tragic $50,613 |
| French American Indians | 2.2 /100 | #243 | Tragic $50,611 |
| Houma | 2.0 /100 | #244 | Tragic $50,547 |
| Hawaiians | 1.9 /100 | #245 | Tragic $50,488 |
| Immigrants | Ecuador | 1.9 /100 | #246 | Tragic $50,474 |
| Sub-Saharan Africans | 1.8 /100 | #247 | Tragic $50,408 |
| Immigrants | Guyana | 1.6 /100 | #248 | Tragic $50,321 |
| Immigrants | Burma/Myanmar | 1.6 /100 | #249 | Tragic $50,298 |
| Osage | 1.6 /100 | #250 | Tragic $50,292 |
| Immigrants | Grenada | 1.6 /100 | #251 | Tragic $50,279 |
| Immigrants | Cabo Verde | 1.2 /100 | #252 | Tragic $50,009 |
| German Russians | 1.1 /100 | #253 | Tragic $49,924 |
| Senegalese | 1.0 /100 | #254 | Tragic $49,774 |
| Alaskan Athabascans | 0.9 /100 | #255 | Tragic $49,748 |