Immigrants from Burma/Myanmar vs Taiwanese Median Male Earnings
COMPARE
Immigrants from Burma/Myanmar
Taiwanese
Median Male Earnings
Median Male Earnings Comparison
Immigrants from Burma/Myanmar
Taiwanese
$50,298
MEDIAN MALE EARNINGS
1.6/ 100
METRIC RATING
249th/ 347
METRIC RANK
$55,556
MEDIAN MALE EARNINGS
73.9/ 100
METRIC RATING
154th/ 347
METRIC RANK
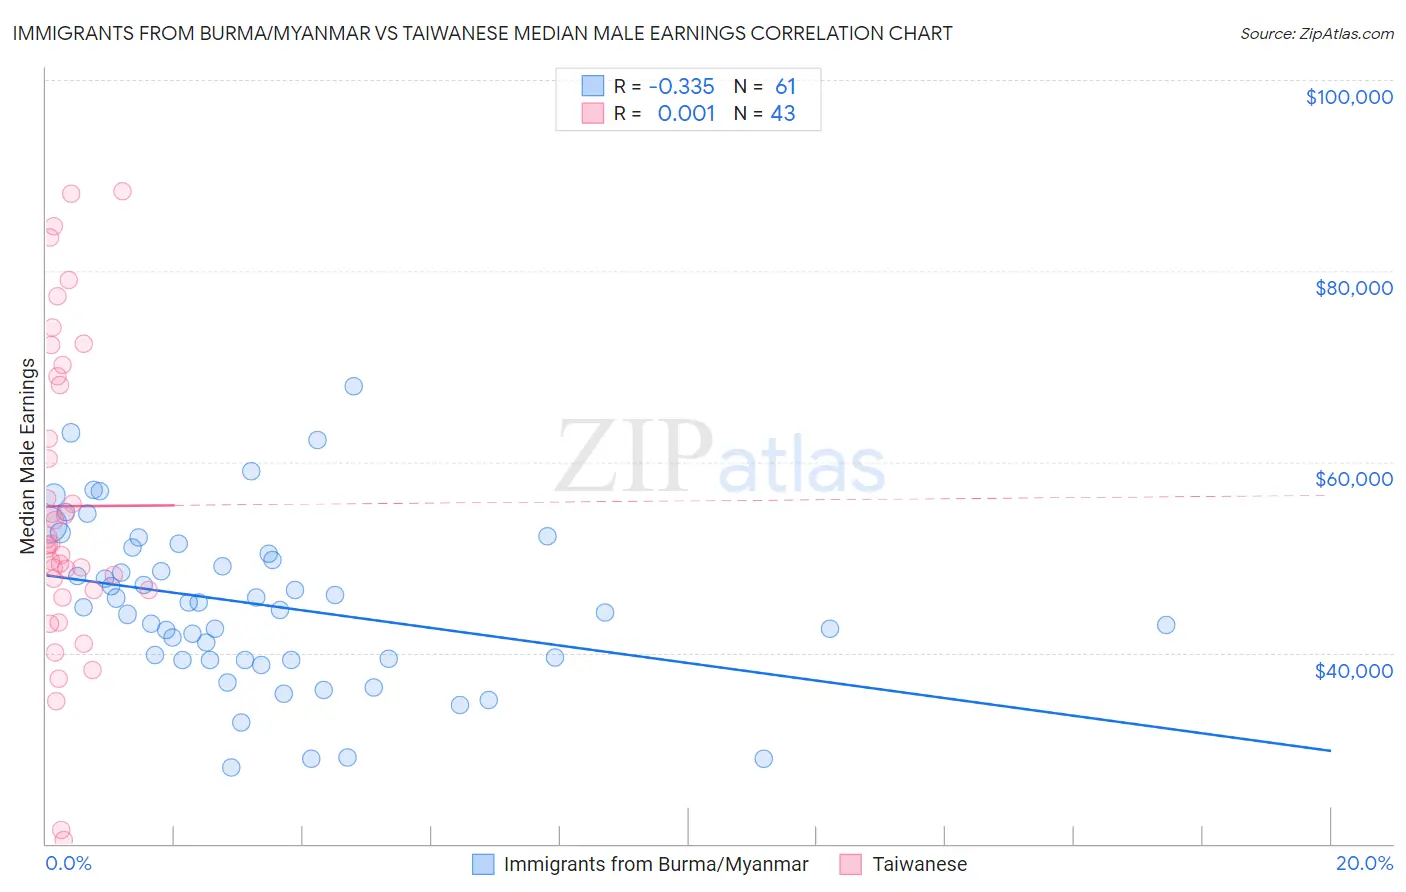
Immigrants from Burma/Myanmar vs Taiwanese Median Male Earnings Correlation Chart
The statistical analysis conducted on geographies consisting of 172,350,242 people shows a mild negative correlation between the proportion of Immigrants from Burma/Myanmar and median male earnings in the United States with a correlation coefficient (R) of -0.335 and weighted average of $50,298. Similarly, the statistical analysis conducted on geographies consisting of 31,719,634 people shows no correlation between the proportion of Taiwanese and median male earnings in the United States with a correlation coefficient (R) of 0.001 and weighted average of $55,556, a difference of 10.4%.
Median Male Earnings Correlation Summary
| Measurement | Immigrants from Burma/Myanmar | Taiwanese |
| Minimum | $27,990 | $20,367 |
| Maximum | $67,960 | $88,333 |
| Range | $39,970 | $67,966 |
| Mean | $45,043 | $55,357 |
| Median | $44,781 | $51,283 |
| Interquartile 25% (IQ1) | $39,264 | $46,547 |
| Interquartile 75% (IQ3) | $50,701 | $68,930 |
| Interquartile Range (IQR) | $11,437 | $22,384 |
| Standard Deviation (Sample) | $8,603 | $16,341 |
| Standard Deviation (Population) | $8,532 | $16,149 |
Similar Demographics by Median Male Earnings
Demographics Similar to Immigrants from Burma/Myanmar by Median Male Earnings
In terms of median male earnings, the demographic groups most similar to Immigrants from Burma/Myanmar are Osage ($50,292, a difference of 0.010%), Immigrants from Grenada ($50,279, a difference of 0.040%), Immigrants from Guyana ($50,321, a difference of 0.050%), Subsaharan African ($50,408, a difference of 0.22%), and Immigrants from Ecuador ($50,474, a difference of 0.35%).
| Demographics | Rating | Rank | Median Male Earnings |
| Guyanese | 2.2 /100 | #242 | Tragic $50,613 |
| French American Indians | 2.2 /100 | #243 | Tragic $50,611 |
| Houma | 2.0 /100 | #244 | Tragic $50,547 |
| Hawaiians | 1.9 /100 | #245 | Tragic $50,488 |
| Immigrants | Ecuador | 1.9 /100 | #246 | Tragic $50,474 |
| Sub-Saharan Africans | 1.8 /100 | #247 | Tragic $50,408 |
| Immigrants | Guyana | 1.6 /100 | #248 | Tragic $50,321 |
| Immigrants | Burma/Myanmar | 1.6 /100 | #249 | Tragic $50,298 |
| Osage | 1.6 /100 | #250 | Tragic $50,292 |
| Immigrants | Grenada | 1.6 /100 | #251 | Tragic $50,279 |
| Immigrants | Cabo Verde | 1.2 /100 | #252 | Tragic $50,009 |
| German Russians | 1.1 /100 | #253 | Tragic $49,924 |
| Senegalese | 1.0 /100 | #254 | Tragic $49,774 |
| Alaskan Athabascans | 0.9 /100 | #255 | Tragic $49,748 |
| Alaska Natives | 0.9 /100 | #256 | Tragic $49,711 |
Demographics Similar to Taiwanese by Median Male Earnings
In terms of median male earnings, the demographic groups most similar to Taiwanese are Scandinavian ($55,527, a difference of 0.050%), Immigrants from Nepal ($55,615, a difference of 0.11%), Peruvian ($55,659, a difference of 0.19%), Immigrants from Ethiopia ($55,434, a difference of 0.22%), and Icelander ($55,415, a difference of 0.25%).
| Demographics | Rating | Rank | Median Male Earnings |
| Immigrants | Philippines | 78.4 /100 | #147 | Good $55,809 |
| Scottish | 78.2 /100 | #148 | Good $55,793 |
| English | 77.4 /100 | #149 | Good $55,747 |
| Swiss | 77.1 /100 | #150 | Good $55,731 |
| Immigrants | Oceania | 76.8 /100 | #151 | Good $55,712 |
| Peruvians | 75.8 /100 | #152 | Good $55,659 |
| Immigrants | Nepal | 75.0 /100 | #153 | Good $55,615 |
| Taiwanese | 73.9 /100 | #154 | Good $55,556 |
| Scandinavians | 73.4 /100 | #155 | Good $55,527 |
| Immigrants | Ethiopia | 71.6 /100 | #156 | Good $55,434 |
| Icelanders | 71.2 /100 | #157 | Good $55,415 |
| Czechoslovakians | 70.5 /100 | #158 | Good $55,382 |
| Alsatians | 70.5 /100 | #159 | Good $55,380 |
| Basques | 70.3 /100 | #160 | Good $55,370 |
| Belgians | 70.1 /100 | #161 | Good $55,361 |