Immigrants from Burma/Myanmar vs Immigrants from Hong Kong Unemployment Among Ages 25 to 29 years
COMPARE
Immigrants from Burma/Myanmar
Immigrants from Hong Kong
Unemployment Among Ages 25 to 29 years
Unemployment Among Ages 25 to 29 years Comparison
Immigrants from Burma/Myanmar
Immigrants from Hong Kong
6.2%
UNEMPLOYMENT AMONG AGES 25 TO 29 YEARS
98.7/ 100
METRIC RATING
56th/ 347
METRIC RANK
6.3%
UNEMPLOYMENT AMONG AGES 25 TO 29 YEARS
97.5/ 100
METRIC RATING
69th/ 347
METRIC RANK
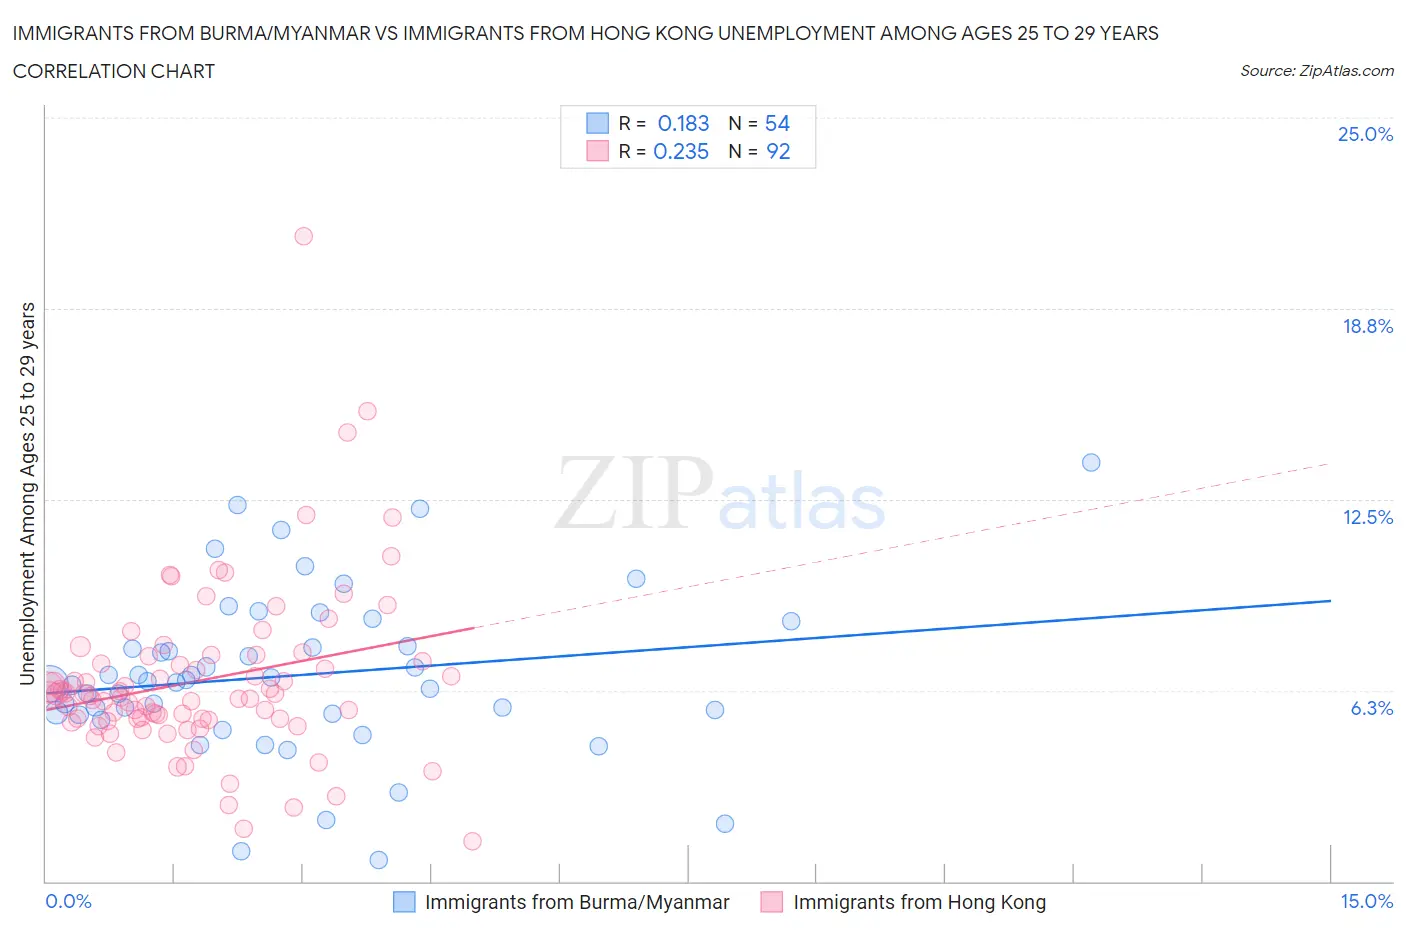
Immigrants from Burma/Myanmar vs Immigrants from Hong Kong Unemployment Among Ages 25 to 29 years Correlation Chart
The statistical analysis conducted on geographies consisting of 169,671,818 people shows a poor positive correlation between the proportion of Immigrants from Burma/Myanmar and unemployment rate among population between the ages 25 and 29 in the United States with a correlation coefficient (R) of 0.183 and weighted average of 6.2%. Similarly, the statistical analysis conducted on geographies consisting of 247,463,754 people shows a weak positive correlation between the proportion of Immigrants from Hong Kong and unemployment rate among population between the ages 25 and 29 in the United States with a correlation coefficient (R) of 0.235 and weighted average of 6.3%, a difference of 1.1%.
Unemployment Among Ages 25 to 29 years Correlation Summary
| Measurement | Immigrants from Burma/Myanmar | Immigrants from Hong Kong |
| Minimum | 0.70% | 1.3% |
| Maximum | 13.7% | 21.1% |
| Range | 13.0% | 19.8% |
| Mean | 6.7% | 6.6% |
| Median | 6.5% | 6.1% |
| Interquartile 25% (IQ1) | 5.5% | 5.3% |
| Interquartile 75% (IQ3) | 7.7% | 7.3% |
| Interquartile Range (IQR) | 2.2% | 2.0% |
| Standard Deviation (Sample) | 2.7% | 2.8% |
| Standard Deviation (Population) | 2.6% | 2.8% |
Demographics Similar to Immigrants from Burma/Myanmar and Immigrants from Hong Kong by Unemployment Among Ages 25 to 29 years
In terms of unemployment among ages 25 to 29 years, the demographic groups most similar to Immigrants from Burma/Myanmar are Immigrants from Netherlands (6.2%, a difference of 0.020%), Immigrants from Saudi Arabia (6.2%, a difference of 0.090%), Swedish (6.2%, a difference of 0.20%), Turkish (6.2%, a difference of 0.22%), and Immigrants from Eastern Asia (6.2%, a difference of 0.25%). Similarly, the demographic groups most similar to Immigrants from Hong Kong are Immigrants from Malaysia (6.3%, a difference of 0.020%), Immigrants from France (6.3%, a difference of 0.060%), Scandinavian (6.3%, a difference of 0.080%), Palestinian (6.3%, a difference of 0.18%), and Indian (Asian) (6.3%, a difference of 0.23%).
| Demographics | Rating | Rank | Unemployment Among Ages 25 to 29 years |
| Immigrants | Turkey | 98.9 /100 | #52 | Exceptional 6.2% |
| Turks | 98.8 /100 | #53 | Exceptional 6.2% |
| Swedes | 98.8 /100 | #54 | Exceptional 6.2% |
| Immigrants | Netherlands | 98.7 /100 | #55 | Exceptional 6.2% |
| Immigrants | Burma/Myanmar | 98.7 /100 | #56 | Exceptional 6.2% |
| Immigrants | Saudi Arabia | 98.6 /100 | #57 | Exceptional 6.2% |
| Immigrants | Eastern Asia | 98.4 /100 | #58 | Exceptional 6.2% |
| Luxembourgers | 98.3 /100 | #59 | Exceptional 6.2% |
| Immigrants | Taiwan | 98.3 /100 | #60 | Exceptional 6.2% |
| Bhutanese | 98.2 /100 | #61 | Exceptional 6.2% |
| Immigrants | China | 98.1 /100 | #62 | Exceptional 6.2% |
| Kenyans | 98.0 /100 | #63 | Exceptional 6.3% |
| Immigrants | Sri Lanka | 97.9 /100 | #64 | Exceptional 6.3% |
| Immigrants | Lebanon | 97.8 /100 | #65 | Exceptional 6.3% |
| Indians (Asian) | 97.8 /100 | #66 | Exceptional 6.3% |
| Immigrants | Northern Africa | 97.8 /100 | #67 | Exceptional 6.3% |
| Palestinians | 97.7 /100 | #68 | Exceptional 6.3% |
| Immigrants | Hong Kong | 97.5 /100 | #69 | Exceptional 6.3% |
| Immigrants | Malaysia | 97.5 /100 | #70 | Exceptional 6.3% |
| Immigrants | France | 97.4 /100 | #71 | Exceptional 6.3% |
| Scandinavians | 97.4 /100 | #72 | Exceptional 6.3% |