Immigrants from Burma/Myanmar vs Native/Alaskan Median Male Earnings
COMPARE
Immigrants from Burma/Myanmar
Native/Alaskan
Median Male Earnings
Median Male Earnings Comparison
Immigrants from Burma/Myanmar
Natives/Alaskans
$50,298
MEDIAN MALE EARNINGS
1.6/ 100
METRIC RATING
249th/ 347
METRIC RANK
$44,775
MEDIAN MALE EARNINGS
0.0/ 100
METRIC RATING
331st/ 347
METRIC RANK
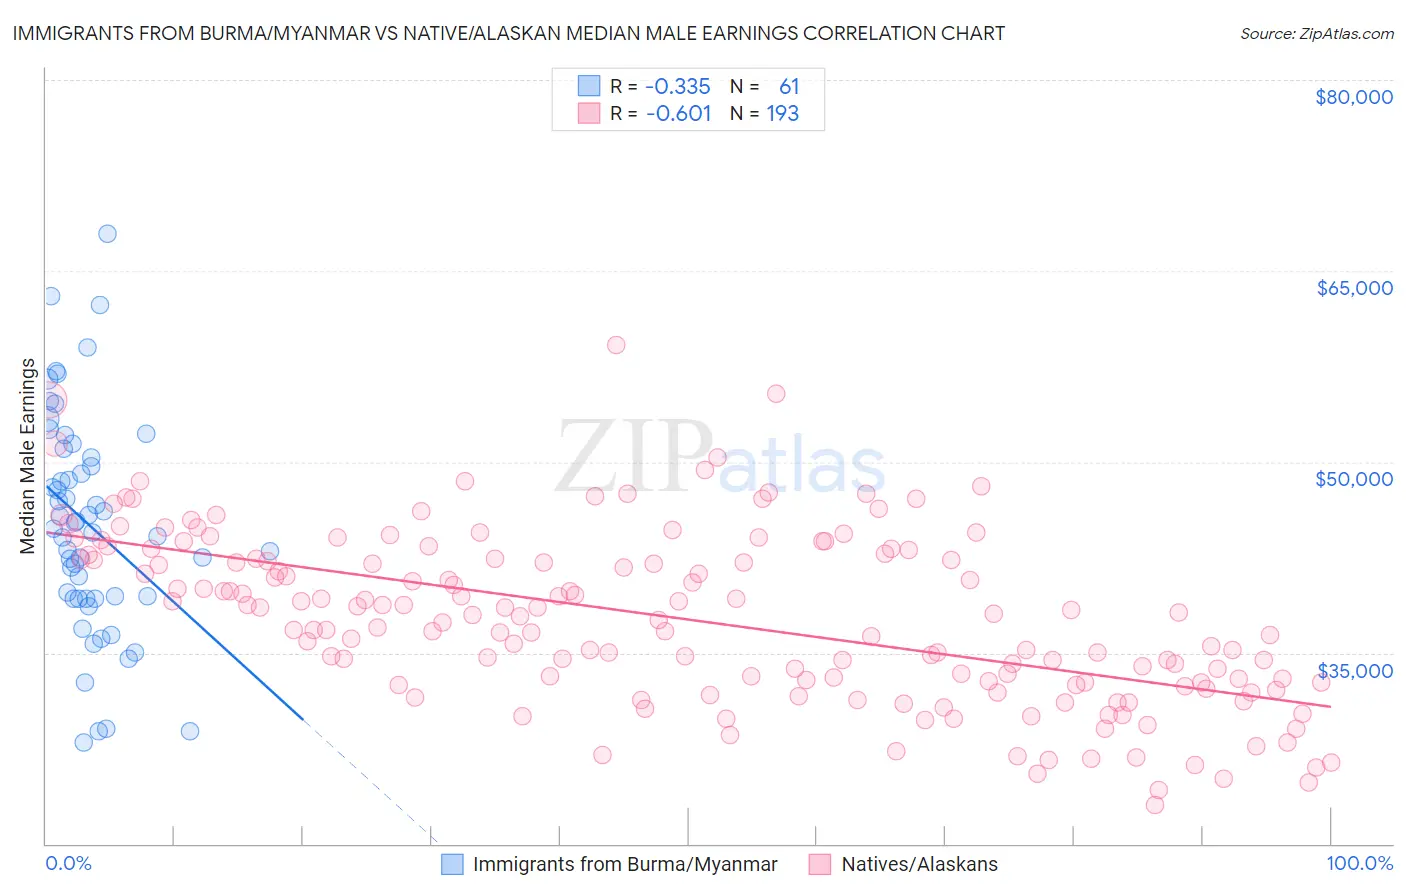
Immigrants from Burma/Myanmar vs Native/Alaskan Median Male Earnings Correlation Chart
The statistical analysis conducted on geographies consisting of 172,350,242 people shows a mild negative correlation between the proportion of Immigrants from Burma/Myanmar and median male earnings in the United States with a correlation coefficient (R) of -0.335 and weighted average of $50,298. Similarly, the statistical analysis conducted on geographies consisting of 512,408,867 people shows a significant negative correlation between the proportion of Natives/Alaskans and median male earnings in the United States with a correlation coefficient (R) of -0.601 and weighted average of $44,775, a difference of 12.3%.
Median Male Earnings Correlation Summary
| Measurement | Immigrants from Burma/Myanmar | Native/Alaskan |
| Minimum | $27,990 | $23,050 |
| Maximum | $67,960 | $59,216 |
| Range | $39,970 | $36,166 |
| Mean | $45,043 | $37,642 |
| Median | $44,781 | $37,848 |
| Interquartile 25% (IQ1) | $39,264 | $32,642 |
| Interquartile 75% (IQ3) | $50,701 | $42,387 |
| Interquartile Range (IQR) | $11,437 | $9,745 |
| Standard Deviation (Sample) | $8,603 | $6,692 |
| Standard Deviation (Population) | $8,532 | $6,675 |
Similar Demographics by Median Male Earnings
Demographics Similar to Immigrants from Burma/Myanmar by Median Male Earnings
In terms of median male earnings, the demographic groups most similar to Immigrants from Burma/Myanmar are Osage ($50,292, a difference of 0.010%), Immigrants from Grenada ($50,279, a difference of 0.040%), Immigrants from Guyana ($50,321, a difference of 0.050%), Subsaharan African ($50,408, a difference of 0.22%), and Immigrants from Ecuador ($50,474, a difference of 0.35%).
| Demographics | Rating | Rank | Median Male Earnings |
| Guyanese | 2.2 /100 | #242 | Tragic $50,613 |
| French American Indians | 2.2 /100 | #243 | Tragic $50,611 |
| Houma | 2.0 /100 | #244 | Tragic $50,547 |
| Hawaiians | 1.9 /100 | #245 | Tragic $50,488 |
| Immigrants | Ecuador | 1.9 /100 | #246 | Tragic $50,474 |
| Sub-Saharan Africans | 1.8 /100 | #247 | Tragic $50,408 |
| Immigrants | Guyana | 1.6 /100 | #248 | Tragic $50,321 |
| Immigrants | Burma/Myanmar | 1.6 /100 | #249 | Tragic $50,298 |
| Osage | 1.6 /100 | #250 | Tragic $50,292 |
| Immigrants | Grenada | 1.6 /100 | #251 | Tragic $50,279 |
| Immigrants | Cabo Verde | 1.2 /100 | #252 | Tragic $50,009 |
| German Russians | 1.1 /100 | #253 | Tragic $49,924 |
| Senegalese | 1.0 /100 | #254 | Tragic $49,774 |
| Alaskan Athabascans | 0.9 /100 | #255 | Tragic $49,748 |
| Alaska Natives | 0.9 /100 | #256 | Tragic $49,711 |
Demographics Similar to Natives/Alaskans by Median Male Earnings
In terms of median male earnings, the demographic groups most similar to Natives/Alaskans are Bahamian ($44,756, a difference of 0.040%), Immigrants from Mexico ($44,960, a difference of 0.41%), Yakama ($45,002, a difference of 0.51%), Kiowa ($45,094, a difference of 0.71%), and Immigrants from Bahamas ($45,176, a difference of 0.90%).
| Demographics | Rating | Rank | Median Male Earnings |
| Blacks/African Americans | 0.0 /100 | #324 | Tragic $45,523 |
| Yuman | 0.0 /100 | #325 | Tragic $45,446 |
| Immigrants | Haiti | 0.0 /100 | #326 | Tragic $45,266 |
| Immigrants | Bahamas | 0.0 /100 | #327 | Tragic $45,176 |
| Kiowa | 0.0 /100 | #328 | Tragic $45,094 |
| Yakama | 0.0 /100 | #329 | Tragic $45,002 |
| Immigrants | Mexico | 0.0 /100 | #330 | Tragic $44,960 |
| Natives/Alaskans | 0.0 /100 | #331 | Tragic $44,775 |
| Bahamians | 0.0 /100 | #332 | Tragic $44,756 |
| Immigrants | Congo | 0.0 /100 | #333 | Tragic $44,204 |
| Immigrants | Yemen | 0.0 /100 | #334 | Tragic $44,083 |
| Spanish American Indians | 0.0 /100 | #335 | Tragic $44,010 |
| Immigrants | Cuba | 0.0 /100 | #336 | Tragic $43,461 |
| Menominee | 0.0 /100 | #337 | Tragic $42,581 |
| Crow | 0.0 /100 | #338 | Tragic $42,434 |