Immigrants from Burma/Myanmar vs Immigrants from Iraq Median Male Earnings
COMPARE
Immigrants from Burma/Myanmar
Immigrants from Iraq
Median Male Earnings
Median Male Earnings Comparison
Immigrants from Burma/Myanmar
Immigrants from Iraq
$50,298
MEDIAN MALE EARNINGS
1.6/ 100
METRIC RATING
249th/ 347
METRIC RANK
$52,681
MEDIAN MALE EARNINGS
14.5/ 100
METRIC RATING
206th/ 347
METRIC RANK
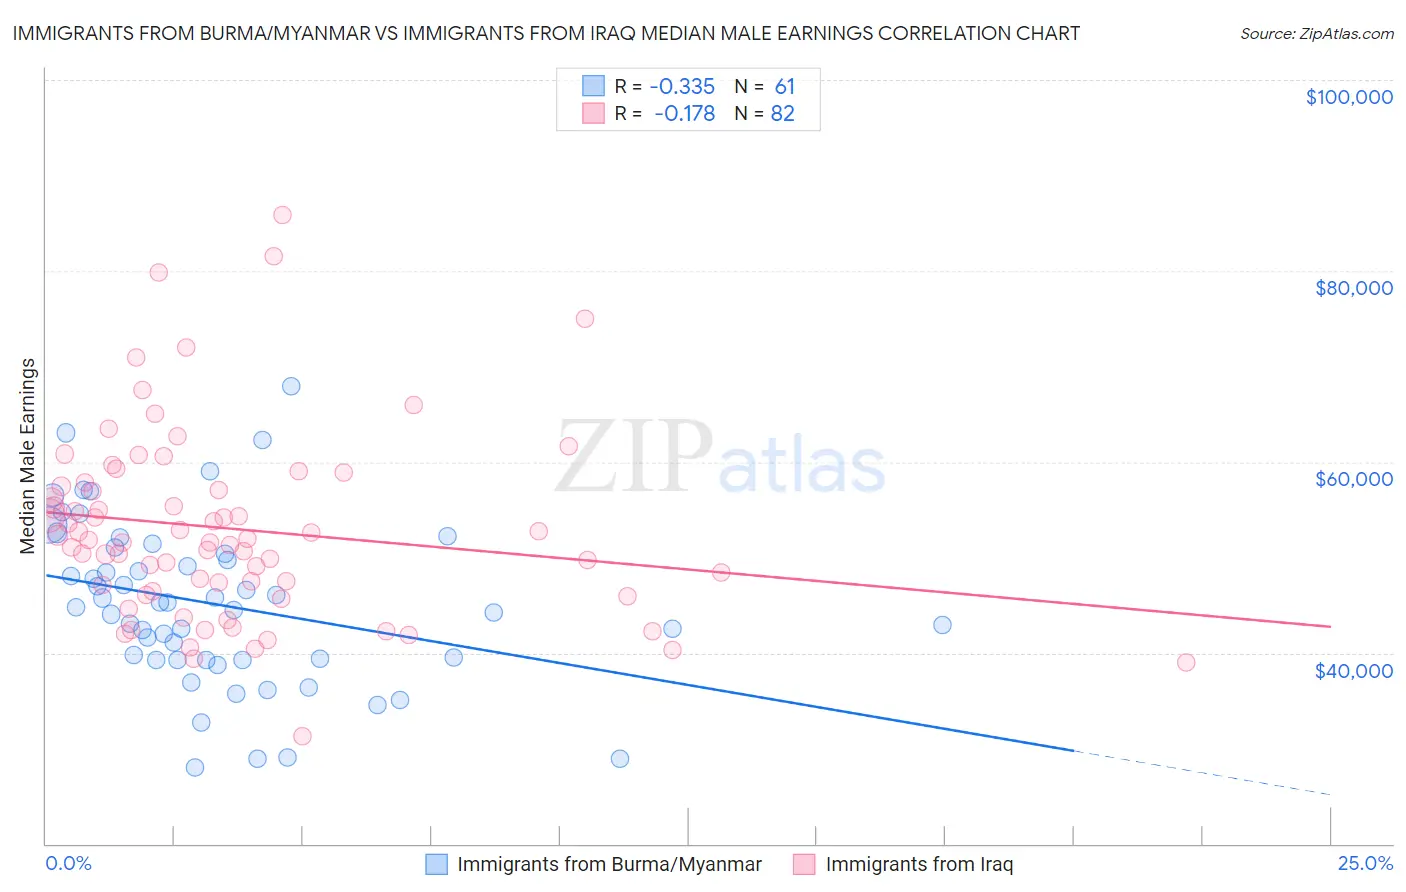
Immigrants from Burma/Myanmar vs Immigrants from Iraq Median Male Earnings Correlation Chart
The statistical analysis conducted on geographies consisting of 172,350,242 people shows a mild negative correlation between the proportion of Immigrants from Burma/Myanmar and median male earnings in the United States with a correlation coefficient (R) of -0.335 and weighted average of $50,298. Similarly, the statistical analysis conducted on geographies consisting of 194,755,120 people shows a poor negative correlation between the proportion of Immigrants from Iraq and median male earnings in the United States with a correlation coefficient (R) of -0.178 and weighted average of $52,681, a difference of 4.7%.
Median Male Earnings Correlation Summary
| Measurement | Immigrants from Burma/Myanmar | Immigrants from Iraq |
| Minimum | $27,990 | $31,325 |
| Maximum | $67,960 | $85,833 |
| Range | $39,970 | $54,508 |
| Mean | $45,043 | $52,958 |
| Median | $44,781 | $51,715 |
| Interquartile 25% (IQ1) | $39,264 | $46,434 |
| Interquartile 75% (IQ3) | $50,701 | $57,443 |
| Interquartile Range (IQR) | $11,437 | $11,008 |
| Standard Deviation (Sample) | $8,603 | $9,945 |
| Standard Deviation (Population) | $8,532 | $9,884 |
Similar Demographics by Median Male Earnings
Demographics Similar to Immigrants from Burma/Myanmar by Median Male Earnings
In terms of median male earnings, the demographic groups most similar to Immigrants from Burma/Myanmar are Osage ($50,292, a difference of 0.010%), Immigrants from Grenada ($50,279, a difference of 0.040%), Immigrants from Guyana ($50,321, a difference of 0.050%), Subsaharan African ($50,408, a difference of 0.22%), and Immigrants from Ecuador ($50,474, a difference of 0.35%).
| Demographics | Rating | Rank | Median Male Earnings |
| Guyanese | 2.2 /100 | #242 | Tragic $50,613 |
| French American Indians | 2.2 /100 | #243 | Tragic $50,611 |
| Houma | 2.0 /100 | #244 | Tragic $50,547 |
| Hawaiians | 1.9 /100 | #245 | Tragic $50,488 |
| Immigrants | Ecuador | 1.9 /100 | #246 | Tragic $50,474 |
| Sub-Saharan Africans | 1.8 /100 | #247 | Tragic $50,408 |
| Immigrants | Guyana | 1.6 /100 | #248 | Tragic $50,321 |
| Immigrants | Burma/Myanmar | 1.6 /100 | #249 | Tragic $50,298 |
| Osage | 1.6 /100 | #250 | Tragic $50,292 |
| Immigrants | Grenada | 1.6 /100 | #251 | Tragic $50,279 |
| Immigrants | Cabo Verde | 1.2 /100 | #252 | Tragic $50,009 |
| German Russians | 1.1 /100 | #253 | Tragic $49,924 |
| Senegalese | 1.0 /100 | #254 | Tragic $49,774 |
| Alaskan Athabascans | 0.9 /100 | #255 | Tragic $49,748 |
| Alaska Natives | 0.9 /100 | #256 | Tragic $49,711 |
Demographics Similar to Immigrants from Iraq by Median Male Earnings
In terms of median male earnings, the demographic groups most similar to Immigrants from Iraq are Immigrants from Colombia ($52,725, a difference of 0.080%), Ghanaian ($52,810, a difference of 0.24%), Panamanian ($52,835, a difference of 0.29%), Vietnamese ($52,525, a difference of 0.30%), and Venezuelan ($52,510, a difference of 0.33%).
| Demographics | Rating | Rank | Median Male Earnings |
| Tongans | 22.3 /100 | #199 | Fair $53,218 |
| Immigrants | Thailand | 17.5 /100 | #200 | Poor $52,908 |
| Immigrants | Bosnia and Herzegovina | 16.9 /100 | #201 | Poor $52,869 |
| Immigrants | Uruguay | 16.8 /100 | #202 | Poor $52,860 |
| Panamanians | 16.5 /100 | #203 | Poor $52,835 |
| Ghanaians | 16.1 /100 | #204 | Poor $52,810 |
| Immigrants | Colombia | 15.0 /100 | #205 | Poor $52,725 |
| Immigrants | Iraq | 14.5 /100 | #206 | Poor $52,681 |
| Vietnamese | 12.7 /100 | #207 | Poor $52,525 |
| Venezuelans | 12.5 /100 | #208 | Poor $52,510 |
| Bermudans | 12.1 /100 | #209 | Poor $52,465 |
| Delaware | 11.5 /100 | #210 | Poor $52,412 |
| Tlingit-Haida | 11.5 /100 | #211 | Poor $52,409 |
| Cajuns | 10.7 /100 | #212 | Poor $52,325 |
| Native Hawaiians | 10.5 /100 | #213 | Poor $52,306 |