Immigrants from Burma/Myanmar vs Immigrants from Hong Kong Vision Disability
COMPARE
Immigrants from Burma/Myanmar
Immigrants from Hong Kong
Vision Disability
Vision Disability Comparison
Immigrants from Burma/Myanmar
Immigrants from Hong Kong
2.2%
VISION DISABILITY
37.9/ 100
METRIC RATING
183rd/ 347
METRIC RANK
1.8%
VISION DISABILITY
100.0/ 100
METRIC RATING
10th/ 347
METRIC RANK
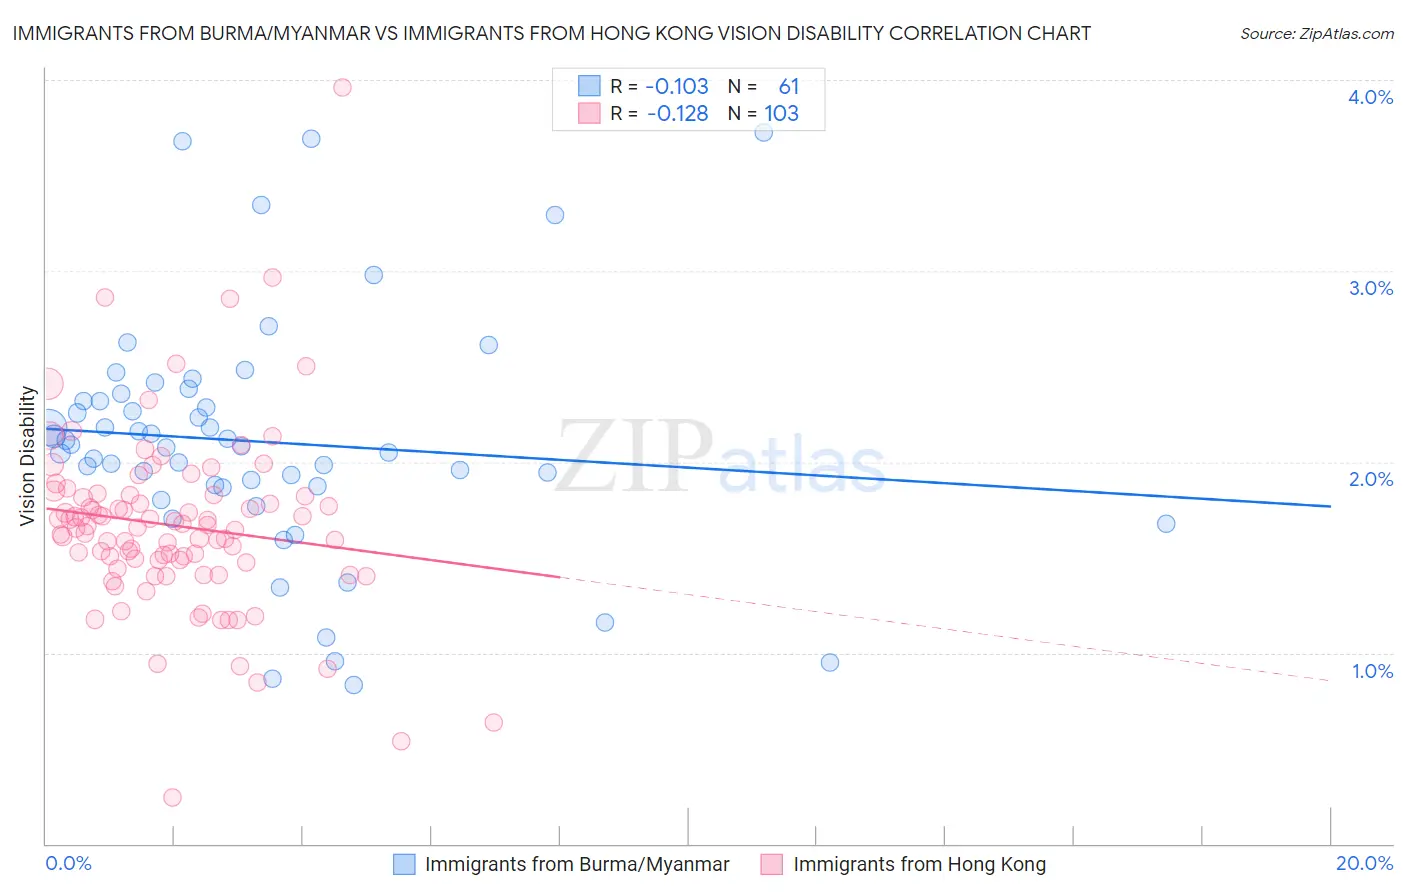
Immigrants from Burma/Myanmar vs Immigrants from Hong Kong Vision Disability Correlation Chart
The statistical analysis conducted on geographies consisting of 172,315,861 people shows a poor negative correlation between the proportion of Immigrants from Burma/Myanmar and percentage of population with vision disability in the United States with a correlation coefficient (R) of -0.103 and weighted average of 2.2%. Similarly, the statistical analysis conducted on geographies consisting of 253,892,306 people shows a poor negative correlation between the proportion of Immigrants from Hong Kong and percentage of population with vision disability in the United States with a correlation coefficient (R) of -0.128 and weighted average of 1.8%, a difference of 20.9%.
Vision Disability Correlation Summary
| Measurement | Immigrants from Burma/Myanmar | Immigrants from Hong Kong |
| Minimum | 0.83% | 0.24% |
| Maximum | 3.7% | 4.0% |
| Range | 2.9% | 3.7% |
| Mean | 2.1% | 1.7% |
| Median | 2.1% | 1.7% |
| Interquartile 25% (IQ1) | 1.9% | 1.5% |
| Interquartile 75% (IQ3) | 2.3% | 1.8% |
| Interquartile Range (IQR) | 0.47% | 0.35% |
| Standard Deviation (Sample) | 0.62% | 0.48% |
| Standard Deviation (Population) | 0.62% | 0.48% |
Similar Demographics by Vision Disability
Demographics Similar to Immigrants from Burma/Myanmar by Vision Disability
In terms of vision disability, the demographic groups most similar to Immigrants from Burma/Myanmar are Moroccan (2.2%, a difference of 0.17%), Costa Rican (2.2%, a difference of 0.19%), Immigrants from Western Europe (2.2%, a difference of 0.21%), Immigrants from Middle Africa (2.2%, a difference of 0.30%), and Uruguayan (2.2%, a difference of 0.31%).
| Demographics | Rating | Rank | Vision Disability |
| Yugoslavians | 46.5 /100 | #176 | Average 2.2% |
| Slavs | 46.0 /100 | #177 | Average 2.2% |
| Immigrants | Oceania | 45.1 /100 | #178 | Average 2.2% |
| Immigrants | North America | 44.5 /100 | #179 | Average 2.2% |
| Uruguayans | 42.7 /100 | #180 | Average 2.2% |
| Immigrants | Western Europe | 41.1 /100 | #181 | Average 2.2% |
| Costa Ricans | 40.7 /100 | #182 | Average 2.2% |
| Immigrants | Burma/Myanmar | 37.9 /100 | #183 | Fair 2.2% |
| Moroccans | 35.4 /100 | #184 | Fair 2.2% |
| Immigrants | Middle Africa | 33.5 /100 | #185 | Fair 2.2% |
| Native Hawaiians | 33.3 /100 | #186 | Fair 2.2% |
| Immigrants | St. Vincent and the Grenadines | 30.3 /100 | #187 | Fair 2.2% |
| Guyanese | 28.9 /100 | #188 | Fair 2.2% |
| Salvadorans | 27.4 /100 | #189 | Fair 2.2% |
| Immigrants | Costa Rica | 26.1 /100 | #190 | Fair 2.2% |
Demographics Similar to Immigrants from Hong Kong by Vision Disability
In terms of vision disability, the demographic groups most similar to Immigrants from Hong Kong are Immigrants from Singapore (1.8%, a difference of 0.19%), Iranian (1.8%, a difference of 0.93%), Immigrants from South Central Asia (1.8%, a difference of 1.1%), Immigrants from Israel (1.8%, a difference of 1.1%), and Immigrants from Iran (1.8%, a difference of 1.1%).
| Demographics | Rating | Rank | Vision Disability |
| Immigrants | Taiwan | 100.0 /100 | #3 | Exceptional 1.7% |
| Thais | 100.0 /100 | #4 | Exceptional 1.7% |
| Okinawans | 100.0 /100 | #5 | Exceptional 1.8% |
| Immigrants | Iran | 100.0 /100 | #6 | Exceptional 1.8% |
| Immigrants | South Central Asia | 100.0 /100 | #7 | Exceptional 1.8% |
| Iranians | 100.0 /100 | #8 | Exceptional 1.8% |
| Immigrants | Singapore | 100.0 /100 | #9 | Exceptional 1.8% |
| Immigrants | Hong Kong | 100.0 /100 | #10 | Exceptional 1.8% |
| Immigrants | Israel | 100.0 /100 | #11 | Exceptional 1.8% |
| Immigrants | Korea | 100.0 /100 | #12 | Exceptional 1.8% |
| Immigrants | Eastern Asia | 100.0 /100 | #13 | Exceptional 1.8% |
| Immigrants | China | 100.0 /100 | #14 | Exceptional 1.8% |
| Immigrants | Bolivia | 100.0 /100 | #15 | Exceptional 1.8% |
| Indians (Asian) | 100.0 /100 | #16 | Exceptional 1.8% |
| Burmese | 100.0 /100 | #17 | Exceptional 1.8% |