Immigrants from Barbados vs Kiowa Wage/Income Gap
COMPARE
Immigrants from Barbados
Kiowa
Wage/Income Gap
Wage/Income Gap Comparison
Immigrants from Barbados
Kiowa
17.8%
WAGE/INCOME GAP
100.0/ 100
METRIC RATING
3rd/ 347
METRIC RANK
23.6%
WAGE/INCOME GAP
99.4/ 100
METRIC RATING
96th/ 347
METRIC RANK
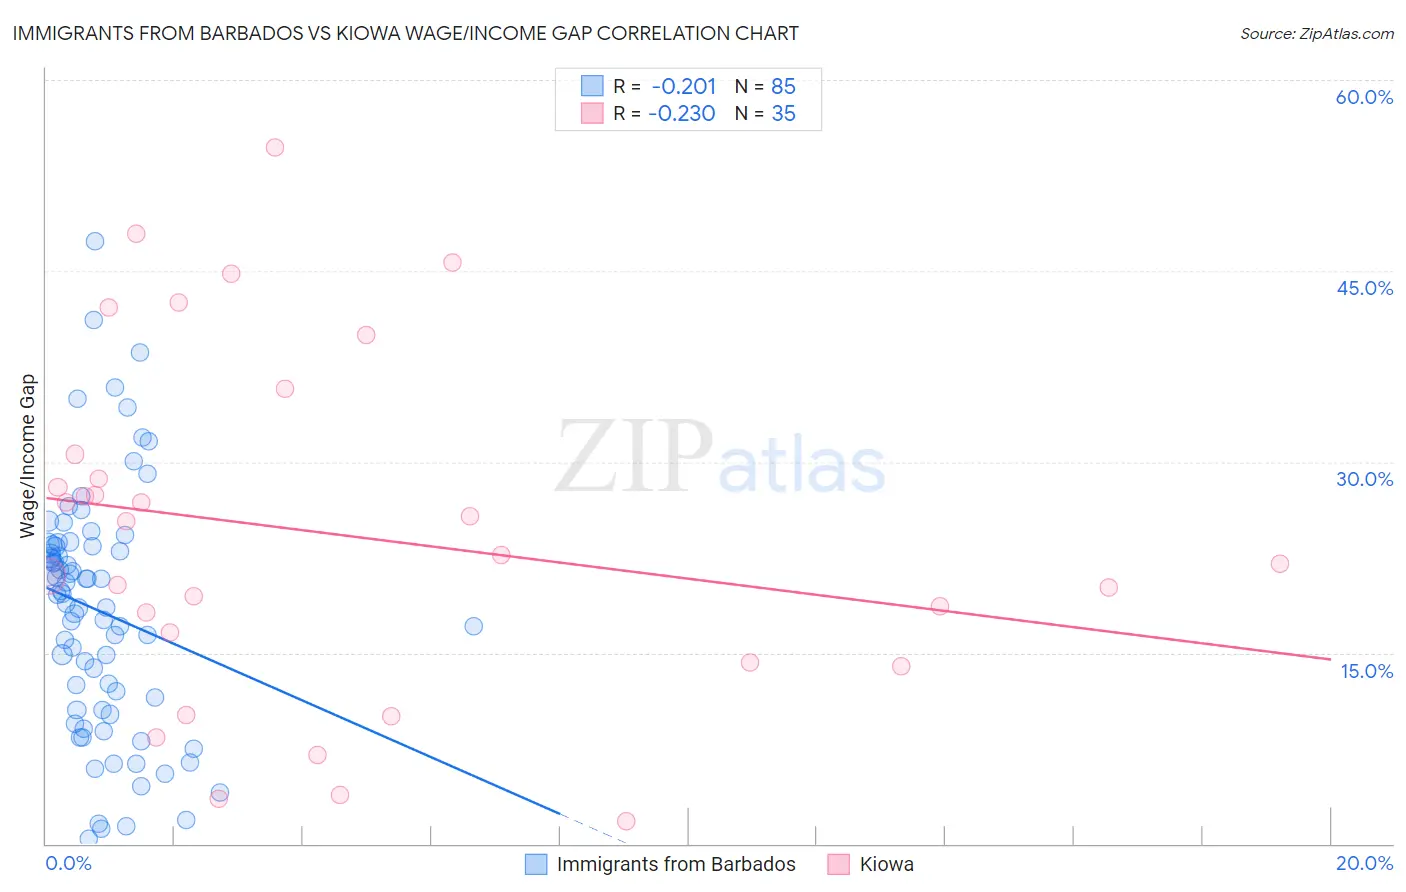
Immigrants from Barbados vs Kiowa Wage/Income Gap Correlation Chart
The statistical analysis conducted on geographies consisting of 112,778,106 people shows a weak negative correlation between the proportion of Immigrants from Barbados and wage/income gap percentage in the United States with a correlation coefficient (R) of -0.201 and weighted average of 17.8%. Similarly, the statistical analysis conducted on geographies consisting of 56,090,422 people shows a weak negative correlation between the proportion of Kiowa and wage/income gap percentage in the United States with a correlation coefficient (R) of -0.230 and weighted average of 23.6%, a difference of 32.4%.
Wage/Income Gap Correlation Summary
| Measurement | Immigrants from Barbados | Kiowa |
| Minimum | 0.43% | 1.7% |
| Maximum | 47.4% | 54.7% |
| Range | 46.9% | 53.0% |
| Mean | 18.3% | 24.3% |
| Median | 19.5% | 22.6% |
| Interquartile 25% (IQ1) | 10.5% | 14.2% |
| Interquartile 75% (IQ3) | 23.4% | 30.6% |
| Interquartile Range (IQR) | 12.9% | 16.4% |
| Standard Deviation (Sample) | 9.6% | 13.5% |
| Standard Deviation (Population) | 9.5% | 13.3% |
Similar Demographics by Wage/Income Gap
Demographics Similar to Immigrants from Barbados by Wage/Income Gap
In terms of wage/income gap, the demographic groups most similar to Immigrants from Barbados are British West Indian (18.0%, a difference of 0.96%), Guyanese (18.3%, a difference of 2.6%), Immigrants from Guyana (18.4%, a difference of 2.9%), Puerto Rican (18.7%, a difference of 4.9%), and Immigrants from Jamaica (18.8%, a difference of 5.6%).
| Demographics | Rating | Rank | Wage/Income Gap |
| Immigrants | Grenada | 100.0 /100 | #1 | Exceptional 16.2% |
| Immigrants | St. Vincent and the Grenadines | 100.0 /100 | #2 | Exceptional 16.4% |
| Immigrants | Barbados | 100.0 /100 | #3 | Exceptional 17.8% |
| British West Indians | 100.0 /100 | #4 | Exceptional 18.0% |
| Guyanese | 100.0 /100 | #5 | Exceptional 18.3% |
| Immigrants | Guyana | 100.0 /100 | #6 | Exceptional 18.4% |
| Puerto Ricans | 100.0 /100 | #7 | Exceptional 18.7% |
| Immigrants | Jamaica | 100.0 /100 | #8 | Exceptional 18.8% |
| Barbadians | 100.0 /100 | #9 | Exceptional 19.0% |
| Crow | 100.0 /100 | #10 | Exceptional 19.1% |
| Immigrants | Haiti | 100.0 /100 | #11 | Exceptional 19.2% |
| Immigrants | West Indies | 100.0 /100 | #12 | Exceptional 19.2% |
| Trinidadians and Tobagonians | 100.0 /100 | #13 | Exceptional 19.3% |
| Immigrants | Trinidad and Tobago | 100.0 /100 | #14 | Exceptional 19.3% |
| West Indians | 100.0 /100 | #15 | Exceptional 19.6% |
Demographics Similar to Kiowa by Wage/Income Gap
In terms of wage/income gap, the demographic groups most similar to Kiowa are Immigrants from Sudan (23.6%, a difference of 0.090%), Cape Verdean (23.6%, a difference of 0.12%), Honduran (23.6%, a difference of 0.15%), Immigrants from Cabo Verde (23.6%, a difference of 0.24%), and Immigrants from Latin America (23.7%, a difference of 0.48%).
| Demographics | Rating | Rank | Wage/Income Gap |
| Marshallese | 99.6 /100 | #89 | Exceptional 23.4% |
| Nicaraguans | 99.6 /100 | #90 | Exceptional 23.4% |
| Arapaho | 99.6 /100 | #91 | Exceptional 23.5% |
| Immigrants | Honduras | 99.5 /100 | #92 | Exceptional 23.5% |
| Immigrants | Cabo Verde | 99.5 /100 | #93 | Exceptional 23.6% |
| Hondurans | 99.5 /100 | #94 | Exceptional 23.6% |
| Cape Verdeans | 99.4 /100 | #95 | Exceptional 23.6% |
| Kiowa | 99.4 /100 | #96 | Exceptional 23.6% |
| Immigrants | Sudan | 99.4 /100 | #97 | Exceptional 23.6% |
| Immigrants | Latin America | 99.2 /100 | #98 | Exceptional 23.7% |
| Aleuts | 99.2 /100 | #99 | Exceptional 23.7% |
| Yakama | 99.2 /100 | #100 | Exceptional 23.7% |
| Japanese | 99.1 /100 | #101 | Exceptional 23.8% |
| Immigrants | Laos | 99.0 /100 | #102 | Exceptional 23.8% |
| Tsimshian | 98.9 /100 | #103 | Exceptional 23.9% |