Immigrants from Barbados vs Immigrants from El Salvador Wage/Income Gap
COMPARE
Immigrants from Barbados
Immigrants from El Salvador
Wage/Income Gap
Wage/Income Gap Comparison
Immigrants from Barbados
Immigrants from El Salvador
17.8%
WAGE/INCOME GAP
100.0/ 100
METRIC RATING
3rd/ 347
METRIC RANK
22.8%
WAGE/INCOME GAP
99.9/ 100
METRIC RATING
71st/ 347
METRIC RANK
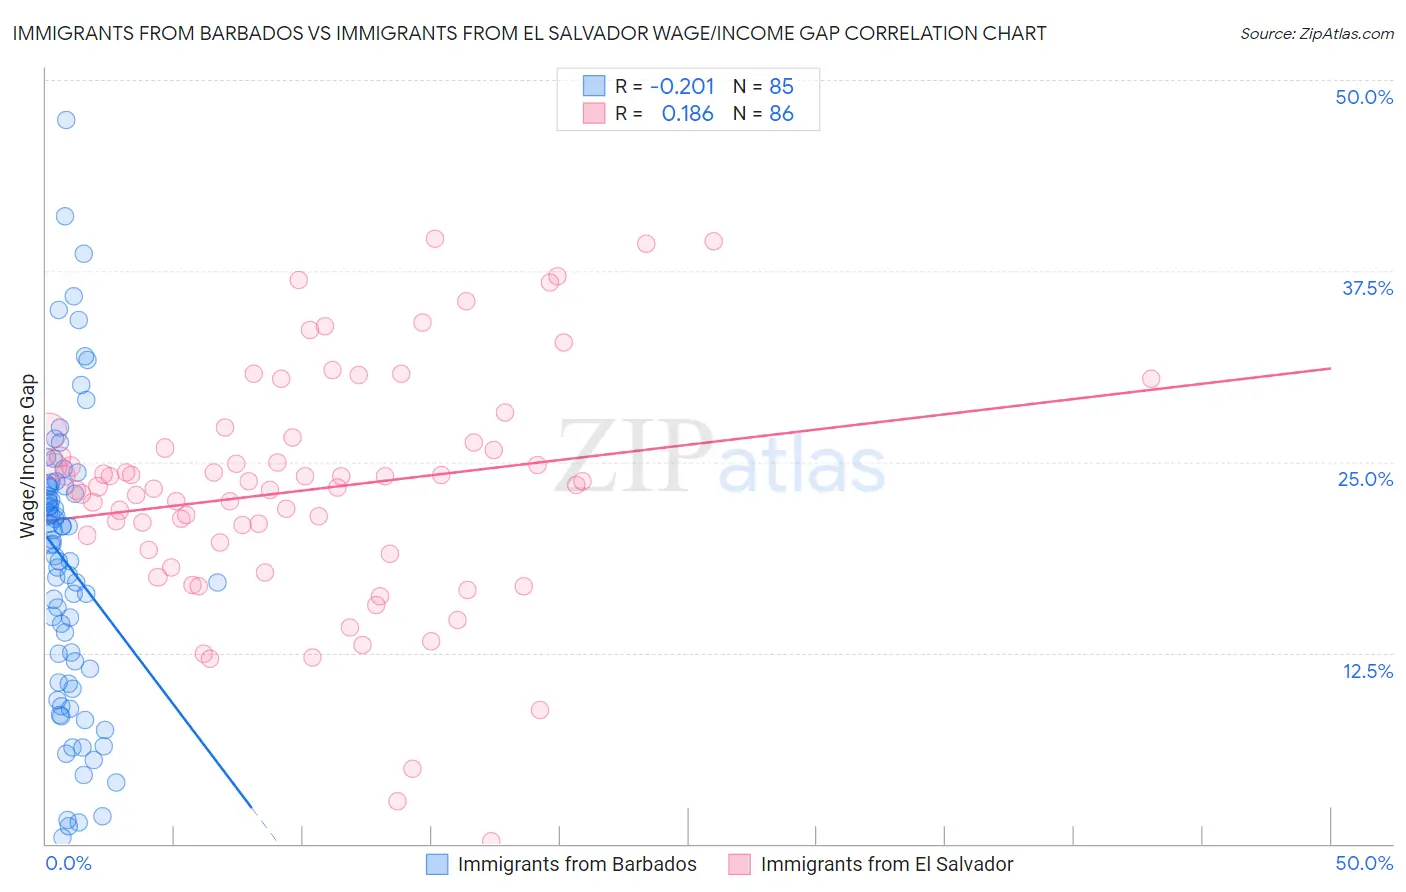
Immigrants from Barbados vs Immigrants from El Salvador Wage/Income Gap Correlation Chart
The statistical analysis conducted on geographies consisting of 112,778,106 people shows a weak negative correlation between the proportion of Immigrants from Barbados and wage/income gap percentage in the United States with a correlation coefficient (R) of -0.201 and weighted average of 17.8%. Similarly, the statistical analysis conducted on geographies consisting of 357,610,247 people shows a poor positive correlation between the proportion of Immigrants from El Salvador and wage/income gap percentage in the United States with a correlation coefficient (R) of 0.186 and weighted average of 22.8%, a difference of 27.7%.
Wage/Income Gap Correlation Summary
| Measurement | Immigrants from Barbados | Immigrants from El Salvador |
| Minimum | 0.43% | 0.18% |
| Maximum | 47.4% | 39.6% |
| Range | 46.9% | 39.4% |
| Mean | 18.3% | 23.2% |
| Median | 19.5% | 23.4% |
| Interquartile 25% (IQ1) | 10.5% | 19.2% |
| Interquartile 75% (IQ3) | 23.4% | 26.3% |
| Interquartile Range (IQR) | 12.9% | 7.1% |
| Standard Deviation (Sample) | 9.6% | 7.7% |
| Standard Deviation (Population) | 9.5% | 7.7% |
Similar Demographics by Wage/Income Gap
Demographics Similar to Immigrants from Barbados by Wage/Income Gap
In terms of wage/income gap, the demographic groups most similar to Immigrants from Barbados are British West Indian (18.0%, a difference of 0.96%), Guyanese (18.3%, a difference of 2.6%), Immigrants from Guyana (18.4%, a difference of 2.9%), Puerto Rican (18.7%, a difference of 4.9%), and Immigrants from Jamaica (18.8%, a difference of 5.6%).
| Demographics | Rating | Rank | Wage/Income Gap |
| Immigrants | Grenada | 100.0 /100 | #1 | Exceptional 16.2% |
| Immigrants | St. Vincent and the Grenadines | 100.0 /100 | #2 | Exceptional 16.4% |
| Immigrants | Barbados | 100.0 /100 | #3 | Exceptional 17.8% |
| British West Indians | 100.0 /100 | #4 | Exceptional 18.0% |
| Guyanese | 100.0 /100 | #5 | Exceptional 18.3% |
| Immigrants | Guyana | 100.0 /100 | #6 | Exceptional 18.4% |
| Puerto Ricans | 100.0 /100 | #7 | Exceptional 18.7% |
| Immigrants | Jamaica | 100.0 /100 | #8 | Exceptional 18.8% |
| Barbadians | 100.0 /100 | #9 | Exceptional 19.0% |
| Crow | 100.0 /100 | #10 | Exceptional 19.1% |
| Immigrants | Haiti | 100.0 /100 | #11 | Exceptional 19.2% |
| Immigrants | West Indies | 100.0 /100 | #12 | Exceptional 19.2% |
| Trinidadians and Tobagonians | 100.0 /100 | #13 | Exceptional 19.3% |
| Immigrants | Trinidad and Tobago | 100.0 /100 | #14 | Exceptional 19.3% |
| West Indians | 100.0 /100 | #15 | Exceptional 19.6% |
Demographics Similar to Immigrants from El Salvador by Wage/Income Gap
In terms of wage/income gap, the demographic groups most similar to Immigrants from El Salvador are Subsaharan African (22.8%, a difference of 0.15%), Immigrants from Uzbekistan (22.7%, a difference of 0.17%), Immigrants from Eastern Africa (22.8%, a difference of 0.18%), Immigrants from Burma/Myanmar (22.8%, a difference of 0.26%), and Indonesian (22.7%, a difference of 0.28%).
| Demographics | Rating | Rank | Wage/Income Gap |
| Spanish American Indians | 100.0 /100 | #64 | Exceptional 22.5% |
| Guatemalans | 99.9 /100 | #65 | Exceptional 22.6% |
| Central American Indians | 99.9 /100 | #66 | Exceptional 22.7% |
| Menominee | 99.9 /100 | #67 | Exceptional 22.7% |
| Immigrants | Nigeria | 99.9 /100 | #68 | Exceptional 22.7% |
| Indonesians | 99.9 /100 | #69 | Exceptional 22.7% |
| Immigrants | Uzbekistan | 99.9 /100 | #70 | Exceptional 22.7% |
| Immigrants | El Salvador | 99.9 /100 | #71 | Exceptional 22.8% |
| Sub-Saharan Africans | 99.9 /100 | #72 | Exceptional 22.8% |
| Immigrants | Eastern Africa | 99.9 /100 | #73 | Exceptional 22.8% |
| Immigrants | Burma/Myanmar | 99.9 /100 | #74 | Exceptional 22.8% |
| Fijians | 99.9 /100 | #75 | Exceptional 22.9% |
| Ecuadorians | 99.9 /100 | #76 | Exceptional 22.9% |
| Africans | 99.9 /100 | #77 | Exceptional 22.9% |
| Nigerians | 99.9 /100 | #78 | Exceptional 23.0% |