Haitian vs Immigrants from Eastern Africa Wage/Income Gap
COMPARE
Haitian
Immigrants from Eastern Africa
Wage/Income Gap
Wage/Income Gap Comparison
Haitians
Immigrants from Eastern Africa
19.7%
WAGE/INCOME GAP
100.0/ 100
METRIC RATING
17th/ 347
METRIC RANK
22.8%
WAGE/INCOME GAP
99.9/ 100
METRIC RATING
73rd/ 347
METRIC RANK
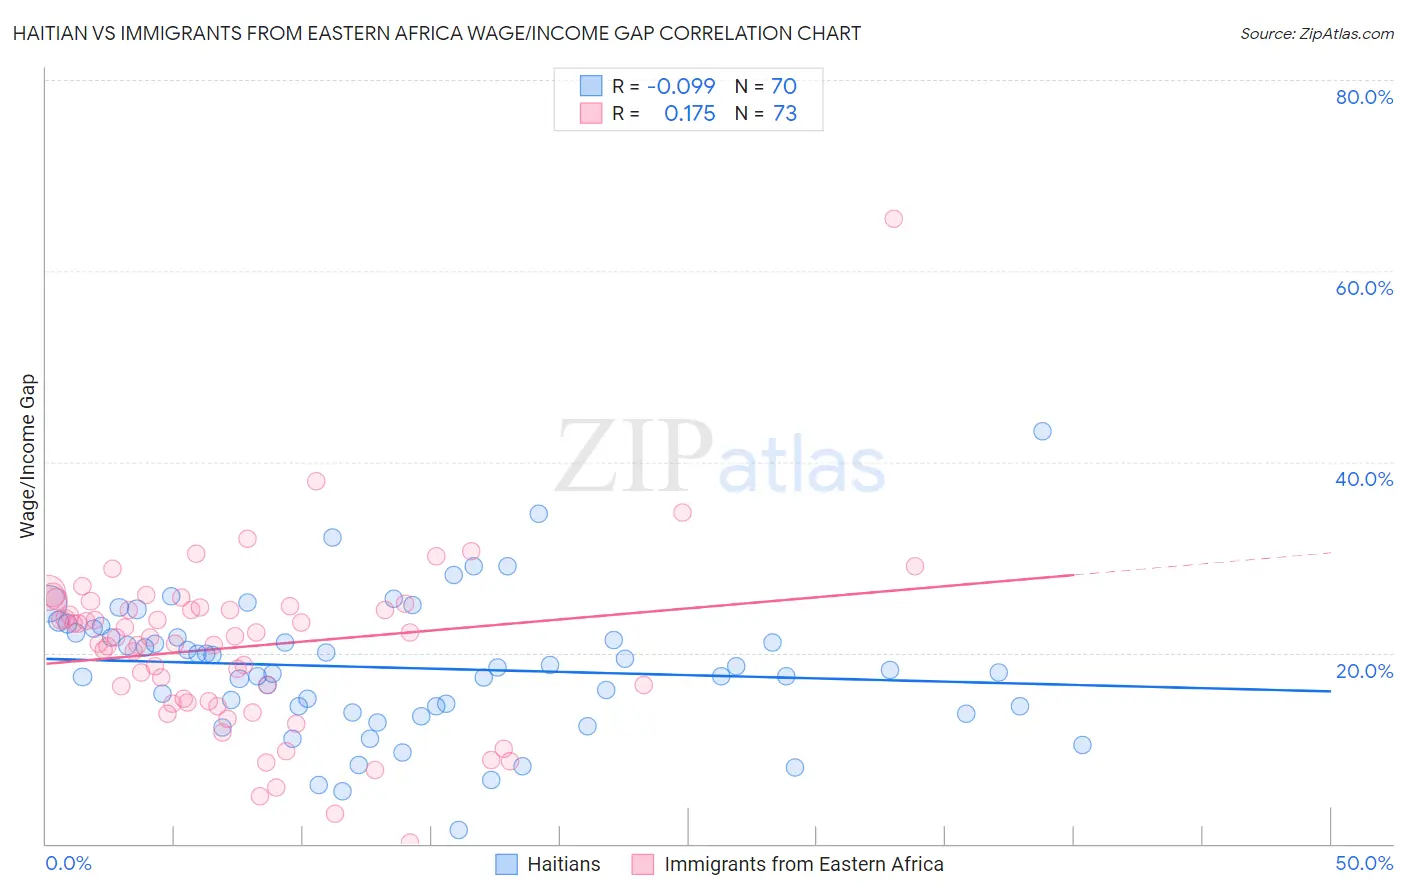
Haitian vs Immigrants from Eastern Africa Wage/Income Gap Correlation Chart
The statistical analysis conducted on geographies consisting of 287,832,408 people shows a slight negative correlation between the proportion of Haitians and wage/income gap percentage in the United States with a correlation coefficient (R) of -0.099 and weighted average of 19.7%. Similarly, the statistical analysis conducted on geographies consisting of 355,004,605 people shows a poor positive correlation between the proportion of Immigrants from Eastern Africa and wage/income gap percentage in the United States with a correlation coefficient (R) of 0.175 and weighted average of 22.8%, a difference of 15.6%.
Wage/Income Gap Correlation Summary
| Measurement | Haitian | Immigrants from Eastern Africa |
| Minimum | 1.5% | 0.17% |
| Maximum | 43.2% | 65.4% |
| Range | 41.7% | 65.3% |
| Mean | 18.4% | 20.7% |
| Median | 18.3% | 21.6% |
| Interquartile 25% (IQ1) | 14.4% | 14.9% |
| Interquartile 75% (IQ3) | 22.1% | 24.8% |
| Interquartile Range (IQR) | 7.7% | 9.9% |
| Standard Deviation (Sample) | 7.1% | 9.1% |
| Standard Deviation (Population) | 7.0% | 9.1% |
Similar Demographics by Wage/Income Gap
Demographics Similar to Haitians by Wage/Income Gap
In terms of wage/income gap, the demographic groups most similar to Haitians are Jamaican (19.6%, a difference of 0.78%), West Indian (19.6%, a difference of 0.91%), Hopi (20.0%, a difference of 1.4%), Immigrants from Dominica (20.0%, a difference of 1.4%), and Immigrants from Trinidad and Tobago (19.3%, a difference of 2.1%).
| Demographics | Rating | Rank | Wage/Income Gap |
| Crow | 100.0 /100 | #10 | Exceptional 19.1% |
| Immigrants | Haiti | 100.0 /100 | #11 | Exceptional 19.2% |
| Immigrants | West Indies | 100.0 /100 | #12 | Exceptional 19.2% |
| Trinidadians and Tobagonians | 100.0 /100 | #13 | Exceptional 19.3% |
| Immigrants | Trinidad and Tobago | 100.0 /100 | #14 | Exceptional 19.3% |
| West Indians | 100.0 /100 | #15 | Exceptional 19.6% |
| Jamaicans | 100.0 /100 | #16 | Exceptional 19.6% |
| Haitians | 100.0 /100 | #17 | Exceptional 19.7% |
| Hopi | 100.0 /100 | #18 | Exceptional 20.0% |
| Immigrants | Dominica | 100.0 /100 | #19 | Exceptional 20.0% |
| Bahamians | 100.0 /100 | #20 | Exceptional 20.2% |
| Immigrants | Caribbean | 100.0 /100 | #21 | Exceptional 20.4% |
| Immigrants | Liberia | 100.0 /100 | #22 | Exceptional 20.6% |
| Immigrants | Dominican Republic | 100.0 /100 | #23 | Exceptional 20.6% |
| Dominicans | 100.0 /100 | #24 | Exceptional 20.6% |
Demographics Similar to Immigrants from Eastern Africa by Wage/Income Gap
In terms of wage/income gap, the demographic groups most similar to Immigrants from Eastern Africa are Subsaharan African (22.8%, a difference of 0.030%), Immigrants from Burma/Myanmar (22.8%, a difference of 0.080%), Immigrants from El Salvador (22.8%, a difference of 0.18%), Immigrants from Uzbekistan (22.7%, a difference of 0.34%), and Fijian (22.9%, a difference of 0.36%).
| Demographics | Rating | Rank | Wage/Income Gap |
| Central American Indians | 99.9 /100 | #66 | Exceptional 22.7% |
| Menominee | 99.9 /100 | #67 | Exceptional 22.7% |
| Immigrants | Nigeria | 99.9 /100 | #68 | Exceptional 22.7% |
| Indonesians | 99.9 /100 | #69 | Exceptional 22.7% |
| Immigrants | Uzbekistan | 99.9 /100 | #70 | Exceptional 22.7% |
| Immigrants | El Salvador | 99.9 /100 | #71 | Exceptional 22.8% |
| Sub-Saharan Africans | 99.9 /100 | #72 | Exceptional 22.8% |
| Immigrants | Eastern Africa | 99.9 /100 | #73 | Exceptional 22.8% |
| Immigrants | Burma/Myanmar | 99.9 /100 | #74 | Exceptional 22.8% |
| Fijians | 99.9 /100 | #75 | Exceptional 22.9% |
| Ecuadorians | 99.9 /100 | #76 | Exceptional 22.9% |
| Africans | 99.9 /100 | #77 | Exceptional 22.9% |
| Nigerians | 99.9 /100 | #78 | Exceptional 23.0% |
| Immigrants | Nicaragua | 99.9 /100 | #79 | Exceptional 23.0% |
| Salvadorans | 99.9 /100 | #80 | Exceptional 23.0% |