Ghanaian vs Soviet Union Per Capita Income
COMPARE
Ghanaian
Soviet Union
Per Capita Income
Per Capita Income Comparison
Ghanaians
Soviet Union
$42,164
PER CAPITA INCOME
15.7/ 100
METRIC RATING
206th/ 347
METRIC RANK
$54,202
PER CAPITA INCOME
100.0/ 100
METRIC RATING
20th/ 347
METRIC RANK
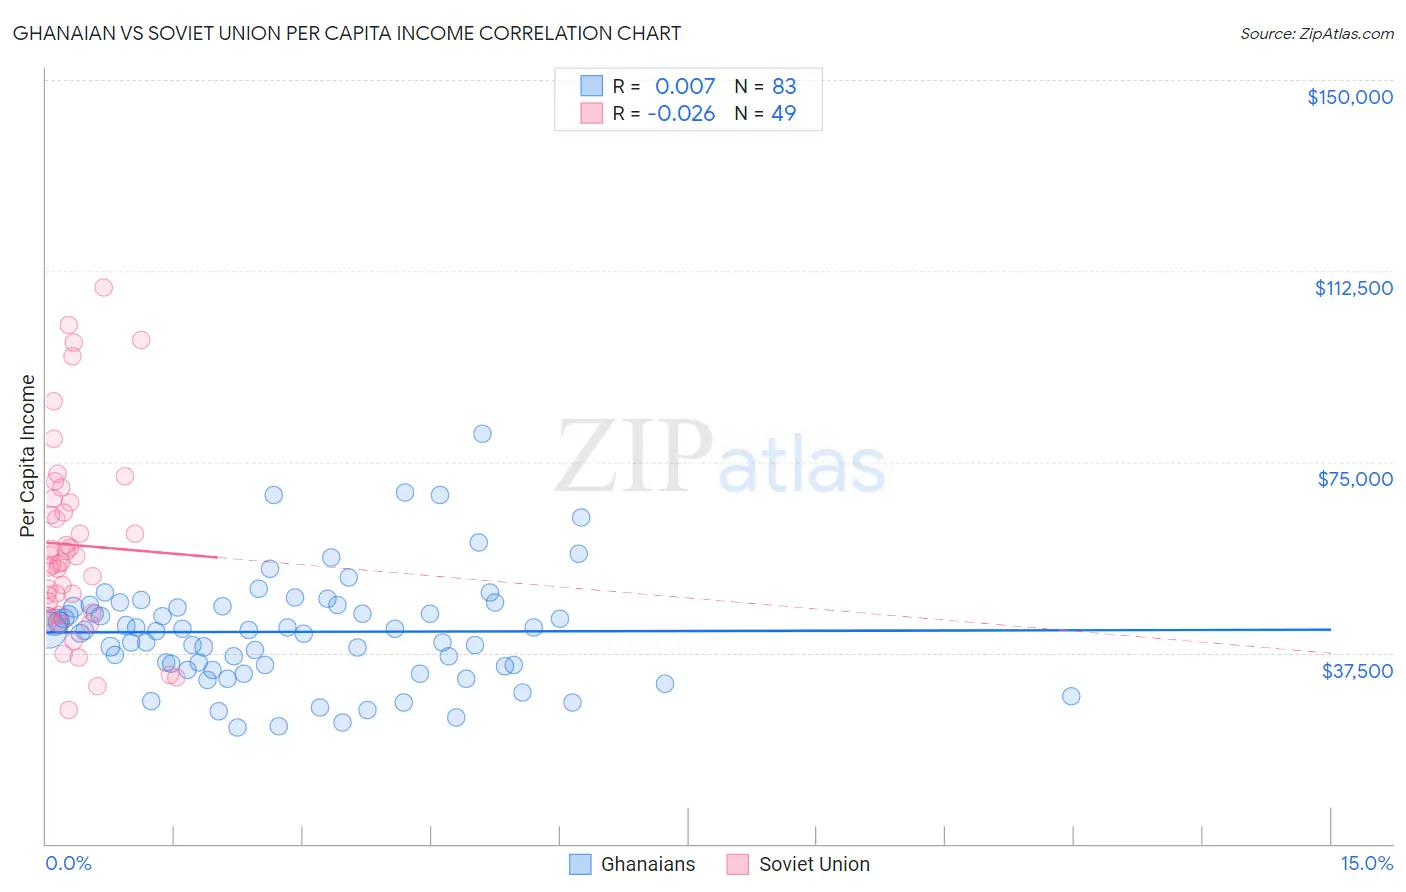
Ghanaian vs Soviet Union Per Capita Income Correlation Chart
The statistical analysis conducted on geographies consisting of 190,723,780 people shows no correlation between the proportion of Ghanaians and per capita income in the United States with a correlation coefficient (R) of 0.007 and weighted average of $42,164. Similarly, the statistical analysis conducted on geographies consisting of 43,511,973 people shows no correlation between the proportion of Soviet Union and per capita income in the United States with a correlation coefficient (R) of -0.026 and weighted average of $54,202, a difference of 28.5%.
Per Capita Income Correlation Summary
| Measurement | Ghanaian | Soviet Union |
| Minimum | $22,951 | $26,314 |
| Maximum | $80,537 | $109,367 |
| Range | $57,586 | $83,053 |
| Mean | $41,613 | $58,669 |
| Median | $41,877 | $55,152 |
| Interquartile 25% (IQ1) | $34,906 | $45,115 |
| Interquartile 75% (IQ3) | $46,657 | $67,421 |
| Interquartile Range (IQR) | $11,751 | $22,306 |
| Standard Deviation (Sample) | $10,874 | $19,133 |
| Standard Deviation (Population) | $10,809 | $18,936 |
Similar Demographics by Per Capita Income
Demographics Similar to Ghanaians by Per Capita Income
In terms of per capita income, the demographic groups most similar to Ghanaians are White/Caucasian ($42,180, a difference of 0.040%), Aleut ($42,210, a difference of 0.11%), Spanish ($42,249, a difference of 0.20%), Venezuelan ($42,074, a difference of 0.21%), and Immigrants from Bosnia and Herzegovina ($42,278, a difference of 0.27%).
| Demographics | Rating | Rank | Per Capita Income |
| Barbadians | 19.6 /100 | #199 | Poor $42,406 |
| Vietnamese | 19.0 /100 | #200 | Poor $42,368 |
| Immigrants | Thailand | 17.6 /100 | #201 | Poor $42,289 |
| Immigrants | Bosnia and Herzegovina | 17.5 /100 | #202 | Poor $42,278 |
| Spanish | 17.0 /100 | #203 | Poor $42,249 |
| Aleuts | 16.4 /100 | #204 | Poor $42,210 |
| Whites/Caucasians | 15.9 /100 | #205 | Poor $42,180 |
| Ghanaians | 15.7 /100 | #206 | Poor $42,164 |
| Venezuelans | 14.4 /100 | #207 | Poor $42,074 |
| Panamanians | 13.9 /100 | #208 | Poor $42,035 |
| Immigrants | Sudan | 13.2 /100 | #209 | Poor $41,986 |
| Ecuadorians | 12.9 /100 | #210 | Poor $41,958 |
| Immigrants | Panama | 11.6 /100 | #211 | Poor $41,853 |
| Immigrants | Senegal | 11.3 /100 | #212 | Poor $41,830 |
| Immigrants | Venezuela | 10.2 /100 | #213 | Poor $41,727 |
Demographics Similar to Soviet Union by Per Capita Income
In terms of per capita income, the demographic groups most similar to Soviet Union are Immigrants from Northern Europe ($54,159, a difference of 0.080%), Immigrants from China ($54,264, a difference of 0.11%), Thai ($54,307, a difference of 0.19%), Indian (Asian) ($53,874, a difference of 0.61%), and Immigrants from France ($54,557, a difference of 0.65%).
| Demographics | Rating | Rank | Per Capita Income |
| Immigrants | India | 100.0 /100 | #13 | Exceptional $55,268 |
| Immigrants | Belgium | 100.0 /100 | #14 | Exceptional $55,082 |
| Cypriots | 100.0 /100 | #15 | Exceptional $54,899 |
| Immigrants | Switzerland | 100.0 /100 | #16 | Exceptional $54,866 |
| Immigrants | France | 100.0 /100 | #17 | Exceptional $54,557 |
| Thais | 100.0 /100 | #18 | Exceptional $54,307 |
| Immigrants | China | 100.0 /100 | #19 | Exceptional $54,264 |
| Soviet Union | 100.0 /100 | #20 | Exceptional $54,202 |
| Immigrants | Northern Europe | 100.0 /100 | #21 | Exceptional $54,159 |
| Indians (Asian) | 100.0 /100 | #22 | Exceptional $53,874 |
| Immigrants | Eastern Asia | 100.0 /100 | #23 | Exceptional $53,806 |
| Immigrants | Denmark | 100.0 /100 | #24 | Exceptional $53,799 |
| Immigrants | Japan | 100.0 /100 | #25 | Exceptional $53,359 |
| Russians | 100.0 /100 | #26 | Exceptional $53,154 |
| Immigrants | South Central Asia | 100.0 /100 | #27 | Exceptional $52,660 |