Cambodian vs Soviet Union Per Capita Income
COMPARE
Cambodian
Soviet Union
Per Capita Income
Per Capita Income Comparison
Cambodians
Soviet Union
$51,731
PER CAPITA INCOME
100.0/ 100
METRIC RATING
39th/ 347
METRIC RANK
$54,202
PER CAPITA INCOME
100.0/ 100
METRIC RATING
20th/ 347
METRIC RANK
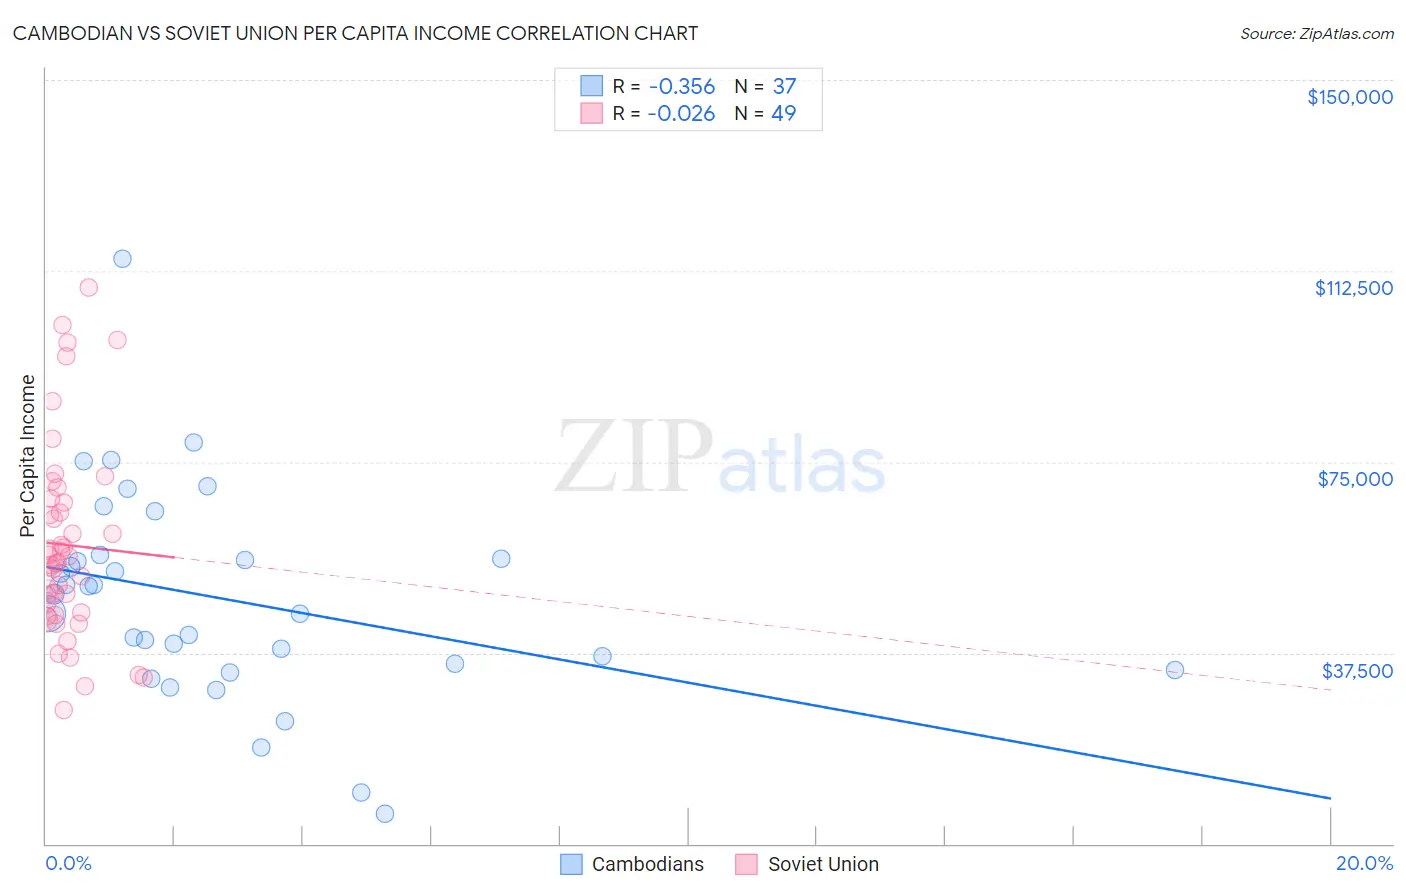
Cambodian vs Soviet Union Per Capita Income Correlation Chart
The statistical analysis conducted on geographies consisting of 102,519,941 people shows a mild negative correlation between the proportion of Cambodians and per capita income in the United States with a correlation coefficient (R) of -0.356 and weighted average of $51,731. Similarly, the statistical analysis conducted on geographies consisting of 43,511,973 people shows no correlation between the proportion of Soviet Union and per capita income in the United States with a correlation coefficient (R) of -0.026 and weighted average of $54,202, a difference of 4.8%.
Per Capita Income Correlation Summary
| Measurement | Cambodian | Soviet Union |
| Minimum | $5,866 | $26,314 |
| Maximum | $114,830 | $109,367 |
| Range | $108,964 | $83,053 |
| Mean | $48,227 | $58,669 |
| Median | $49,059 | $55,152 |
| Interquartile 25% (IQ1) | $34,778 | $45,115 |
| Interquartile 75% (IQ3) | $56,350 | $67,421 |
| Interquartile Range (IQR) | $21,571 | $22,306 |
| Standard Deviation (Sample) | $20,684 | $19,133 |
| Standard Deviation (Population) | $20,403 | $18,936 |
Demographics Similar to Cambodians and Soviet Union by Per Capita Income
In terms of per capita income, the demographic groups most similar to Cambodians are Immigrants from Czechoslovakia ($51,770, a difference of 0.070%), Estonian ($51,875, a difference of 0.28%), Immigrants from Greece ($51,891, a difference of 0.31%), Burmese ($52,005, a difference of 0.53%), and Immigrants from Russia ($52,044, a difference of 0.60%). Similarly, the demographic groups most similar to Soviet Union are Immigrants from Northern Europe ($54,159, a difference of 0.080%), Immigrants from China ($54,264, a difference of 0.11%), Indian (Asian) ($53,874, a difference of 0.61%), Immigrants from Eastern Asia ($53,806, a difference of 0.74%), and Immigrants from Denmark ($53,799, a difference of 0.75%).
| Demographics | Rating | Rank | Per Capita Income |
| Immigrants | China | 100.0 /100 | #19 | Exceptional $54,264 |
| Soviet Union | 100.0 /100 | #20 | Exceptional $54,202 |
| Immigrants | Northern Europe | 100.0 /100 | #21 | Exceptional $54,159 |
| Indians (Asian) | 100.0 /100 | #22 | Exceptional $53,874 |
| Immigrants | Eastern Asia | 100.0 /100 | #23 | Exceptional $53,806 |
| Immigrants | Denmark | 100.0 /100 | #24 | Exceptional $53,799 |
| Immigrants | Japan | 100.0 /100 | #25 | Exceptional $53,359 |
| Russians | 100.0 /100 | #26 | Exceptional $53,154 |
| Immigrants | South Central Asia | 100.0 /100 | #27 | Exceptional $52,660 |
| Latvians | 100.0 /100 | #28 | Exceptional $52,649 |
| Israelis | 100.0 /100 | #29 | Exceptional $52,596 |
| Immigrants | Austria | 100.0 /100 | #30 | Exceptional $52,503 |
| Turks | 100.0 /100 | #31 | Exceptional $52,391 |
| Immigrants | Norway | 100.0 /100 | #32 | Exceptional $52,217 |
| Australians | 100.0 /100 | #33 | Exceptional $52,074 |
| Immigrants | Russia | 100.0 /100 | #34 | Exceptional $52,044 |
| Burmese | 100.0 /100 | #35 | Exceptional $52,005 |
| Immigrants | Greece | 100.0 /100 | #36 | Exceptional $51,891 |
| Estonians | 100.0 /100 | #37 | Exceptional $51,875 |
| Immigrants | Czechoslovakia | 100.0 /100 | #38 | Exceptional $51,770 |
| Cambodians | 100.0 /100 | #39 | Exceptional $51,731 |