Alsatian vs Soviet Union Per Capita Income
COMPARE
Alsatian
Soviet Union
Per Capita Income
Per Capita Income Comparison
Alsatians
Soviet Union
$47,284
PER CAPITA INCOME
98.3/ 100
METRIC RATING
96th/ 347
METRIC RANK
$54,202
PER CAPITA INCOME
100.0/ 100
METRIC RATING
20th/ 347
METRIC RANK
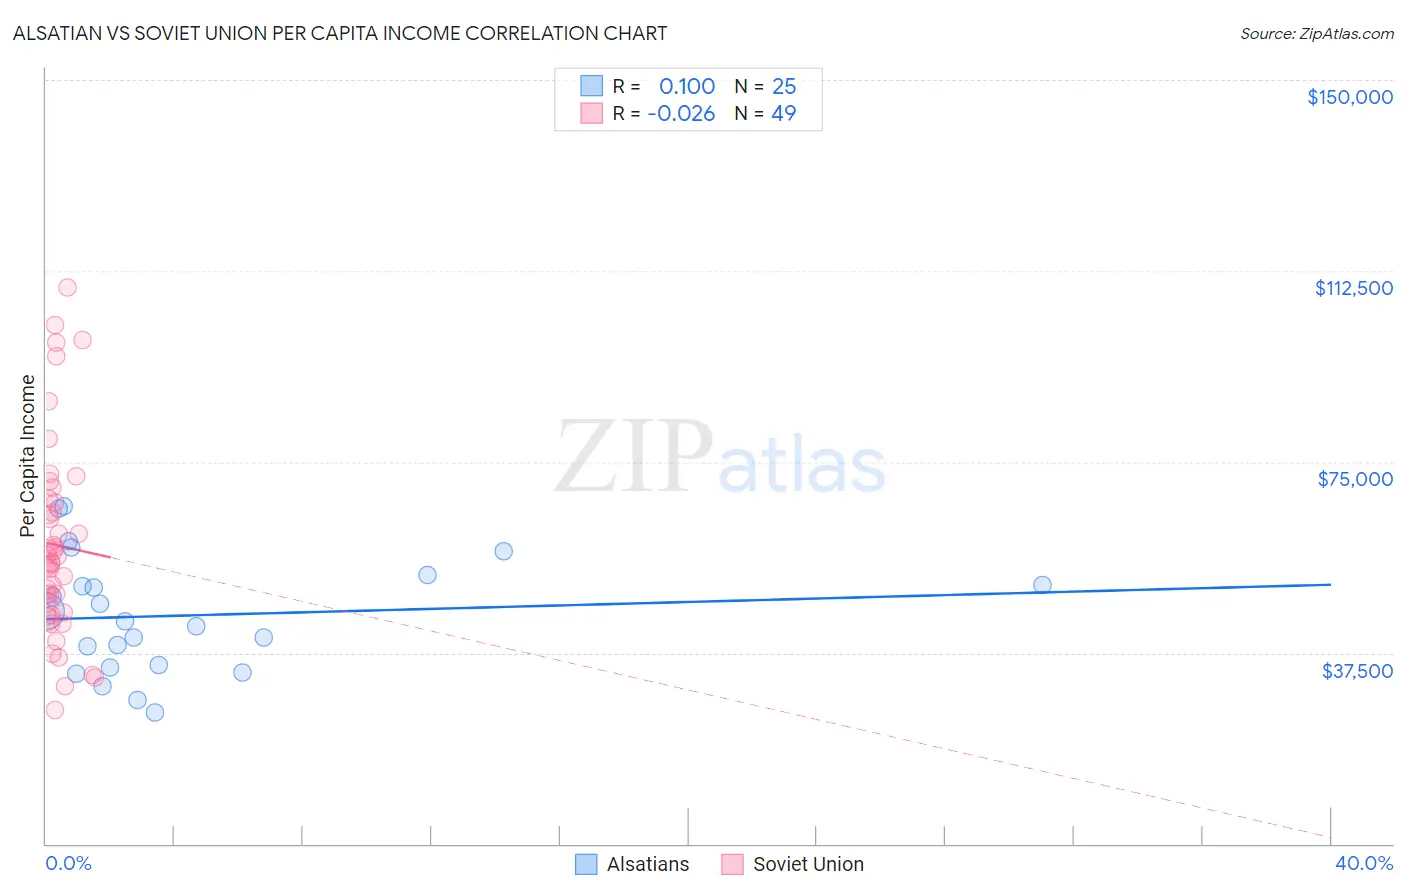
Alsatian vs Soviet Union Per Capita Income Correlation Chart
The statistical analysis conducted on geographies consisting of 82,682,365 people shows a slight positive correlation between the proportion of Alsatians and per capita income in the United States with a correlation coefficient (R) of 0.100 and weighted average of $47,284. Similarly, the statistical analysis conducted on geographies consisting of 43,511,973 people shows no correlation between the proportion of Soviet Union and per capita income in the United States with a correlation coefficient (R) of -0.026 and weighted average of $54,202, a difference of 14.6%.
Per Capita Income Correlation Summary
| Measurement | Alsatian | Soviet Union |
| Minimum | $25,853 | $26,314 |
| Maximum | $66,221 | $109,367 |
| Range | $40,368 | $83,053 |
| Mean | $44,810 | $58,669 |
| Median | $43,610 | $55,152 |
| Interquartile 25% (IQ1) | $34,894 | $45,115 |
| Interquartile 75% (IQ3) | $51,799 | $67,421 |
| Interquartile Range (IQR) | $16,905 | $22,306 |
| Standard Deviation (Sample) | $11,224 | $19,133 |
| Standard Deviation (Population) | $10,998 | $18,936 |
Similar Demographics by Per Capita Income
Demographics Similar to Alsatians by Per Capita Income
In terms of per capita income, the demographic groups most similar to Alsatians are Carpatho Rusyn ($47,248, a difference of 0.080%), Immigrants from Egypt ($47,361, a difference of 0.16%), Albanian ($47,379, a difference of 0.20%), Immigrants from Zimbabwe ($47,394, a difference of 0.23%), and Immigrants from Moldova ($47,489, a difference of 0.43%).
| Demographics | Rating | Rank | Per Capita Income |
| Northern Europeans | 98.9 /100 | #89 | Exceptional $47,698 |
| Italians | 98.8 /100 | #90 | Exceptional $47,574 |
| Macedonians | 98.8 /100 | #91 | Exceptional $47,573 |
| Immigrants | Moldova | 98.7 /100 | #92 | Exceptional $47,489 |
| Immigrants | Zimbabwe | 98.5 /100 | #93 | Exceptional $47,394 |
| Albanians | 98.5 /100 | #94 | Exceptional $47,379 |
| Immigrants | Egypt | 98.5 /100 | #95 | Exceptional $47,361 |
| Alsatians | 98.3 /100 | #96 | Exceptional $47,284 |
| Carpatho Rusyns | 98.2 /100 | #97 | Exceptional $47,248 |
| Immigrants | Pakistan | 97.9 /100 | #98 | Exceptional $47,084 |
| Laotians | 97.8 /100 | #99 | Exceptional $47,041 |
| Immigrants | Lebanon | 97.5 /100 | #100 | Exceptional $46,938 |
| Immigrants | Uzbekistan | 97.5 /100 | #101 | Exceptional $46,929 |
| Immigrants | Western Asia | 97.4 /100 | #102 | Exceptional $46,876 |
| Syrians | 97.2 /100 | #103 | Exceptional $46,837 |
Demographics Similar to Soviet Union by Per Capita Income
In terms of per capita income, the demographic groups most similar to Soviet Union are Immigrants from Northern Europe ($54,159, a difference of 0.080%), Immigrants from China ($54,264, a difference of 0.11%), Thai ($54,307, a difference of 0.19%), Indian (Asian) ($53,874, a difference of 0.61%), and Immigrants from France ($54,557, a difference of 0.65%).
| Demographics | Rating | Rank | Per Capita Income |
| Immigrants | India | 100.0 /100 | #13 | Exceptional $55,268 |
| Immigrants | Belgium | 100.0 /100 | #14 | Exceptional $55,082 |
| Cypriots | 100.0 /100 | #15 | Exceptional $54,899 |
| Immigrants | Switzerland | 100.0 /100 | #16 | Exceptional $54,866 |
| Immigrants | France | 100.0 /100 | #17 | Exceptional $54,557 |
| Thais | 100.0 /100 | #18 | Exceptional $54,307 |
| Immigrants | China | 100.0 /100 | #19 | Exceptional $54,264 |
| Soviet Union | 100.0 /100 | #20 | Exceptional $54,202 |
| Immigrants | Northern Europe | 100.0 /100 | #21 | Exceptional $54,159 |
| Indians (Asian) | 100.0 /100 | #22 | Exceptional $53,874 |
| Immigrants | Eastern Asia | 100.0 /100 | #23 | Exceptional $53,806 |
| Immigrants | Denmark | 100.0 /100 | #24 | Exceptional $53,799 |
| Immigrants | Japan | 100.0 /100 | #25 | Exceptional $53,359 |
| Russians | 100.0 /100 | #26 | Exceptional $53,154 |
| Immigrants | South Central Asia | 100.0 /100 | #27 | Exceptional $52,660 |