Ghanaian vs Soviet Union High School Diploma
COMPARE
Ghanaian
Soviet Union
High School Diploma
High School Diploma Comparison
Ghanaians
Soviet Union
87.7%
HIGH SCHOOL DIPLOMA
1.4/ 100
METRIC RATING
251st/ 347
METRIC RANK
90.9%
HIGH SCHOOL DIPLOMA
99.4/ 100
METRIC RATING
72nd/ 347
METRIC RANK
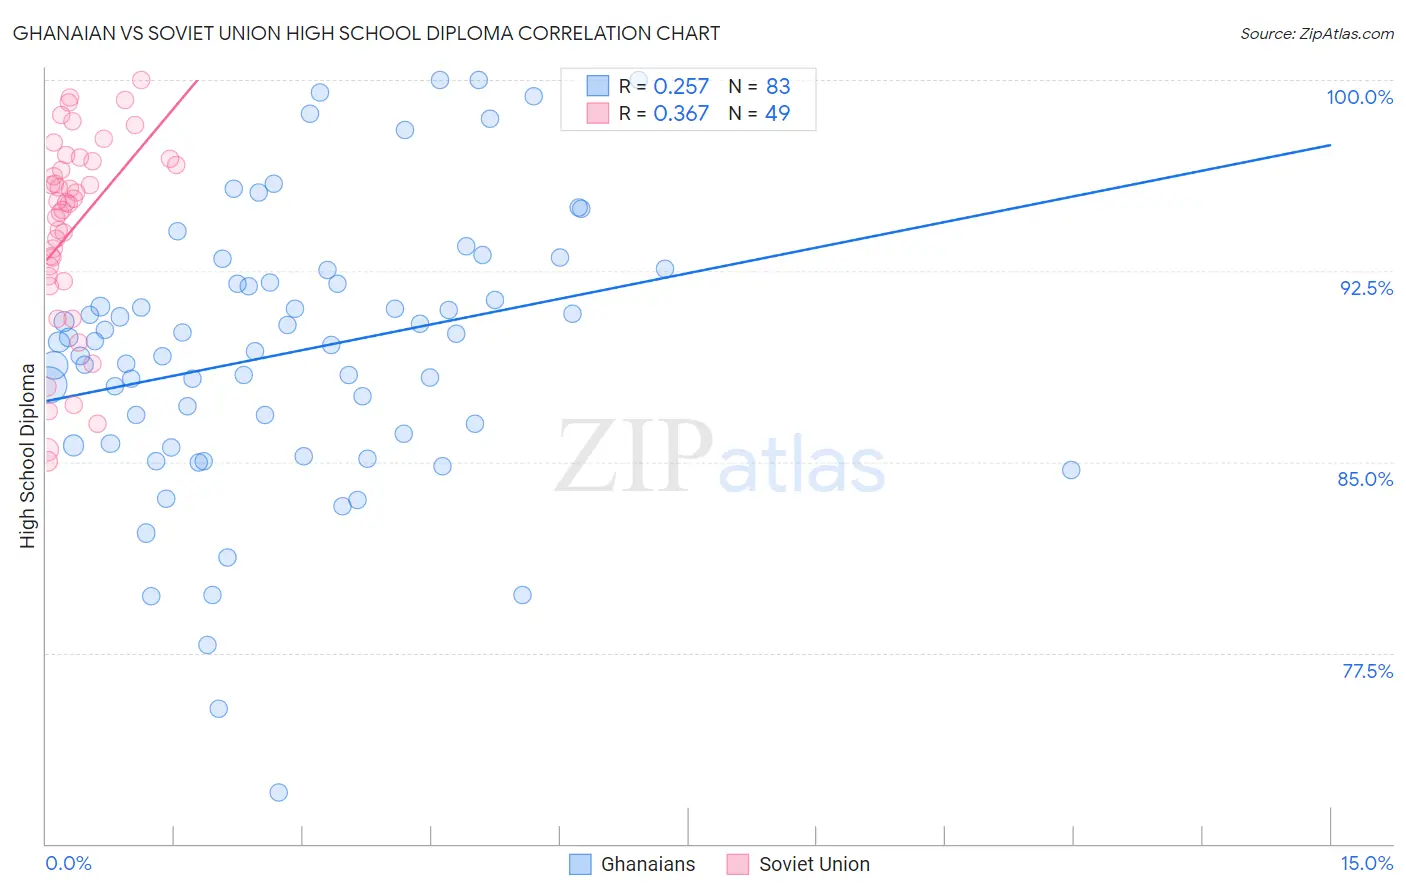
Ghanaian vs Soviet Union High School Diploma Correlation Chart
The statistical analysis conducted on geographies consisting of 190,714,079 people shows a weak positive correlation between the proportion of Ghanaians and percentage of population with at least high school diploma education in the United States with a correlation coefficient (R) of 0.257 and weighted average of 87.7%. Similarly, the statistical analysis conducted on geographies consisting of 43,454,395 people shows a mild positive correlation between the proportion of Soviet Union and percentage of population with at least high school diploma education in the United States with a correlation coefficient (R) of 0.367 and weighted average of 90.9%, a difference of 3.6%.
High School Diploma Correlation Summary
| Measurement | Ghanaian | Soviet Union |
| Minimum | 72.0% | 85.0% |
| Maximum | 100.0% | 100.0% |
| Range | 28.0% | 15.0% |
| Mean | 89.3% | 94.2% |
| Median | 89.7% | 95.2% |
| Interquartile 25% (IQ1) | 85.7% | 92.2% |
| Interquartile 75% (IQ3) | 92.1% | 96.9% |
| Interquartile Range (IQR) | 6.3% | 4.7% |
| Standard Deviation (Sample) | 5.5% | 3.8% |
| Standard Deviation (Population) | 5.5% | 3.8% |
Similar Demographics by High School Diploma
Demographics Similar to Ghanaians by High School Diploma
In terms of high school diploma, the demographic groups most similar to Ghanaians are Senegalese (87.7%, a difference of 0.040%), Immigrants from Nigeria (87.7%, a difference of 0.040%), Spanish American (87.7%, a difference of 0.050%), Immigrants from South America (87.6%, a difference of 0.060%), and Immigrants from Eritrea (87.8%, a difference of 0.090%).
| Demographics | Rating | Rank | High School Diploma |
| Choctaw | 1.9 /100 | #244 | Tragic 87.8% |
| Peruvians | 1.9 /100 | #245 | Tragic 87.8% |
| Immigrants | Eritrea | 1.7 /100 | #246 | Tragic 87.8% |
| Immigrants | Costa Rica | 1.7 /100 | #247 | Tragic 87.8% |
| Spanish Americans | 1.5 /100 | #248 | Tragic 87.7% |
| Senegalese | 1.5 /100 | #249 | Tragic 87.7% |
| Immigrants | Nigeria | 1.5 /100 | #250 | Tragic 87.7% |
| Ghanaians | 1.4 /100 | #251 | Tragic 87.7% |
| Immigrants | South America | 1.2 /100 | #252 | Tragic 87.6% |
| Immigrants | Uruguay | 1.0 /100 | #253 | Tragic 87.6% |
| Immigrants | Colombia | 1.0 /100 | #254 | Tragic 87.6% |
| Immigrants | Senegal | 0.9 /100 | #255 | Tragic 87.6% |
| Africans | 0.7 /100 | #256 | Tragic 87.5% |
| Bahamians | 0.7 /100 | #257 | Tragic 87.5% |
| Immigrants | Ghana | 0.5 /100 | #258 | Tragic 87.4% |
Demographics Similar to Soviet Union by High School Diploma
In terms of high school diploma, the demographic groups most similar to Soviet Union are Alaskan Athabascan (90.9%, a difference of 0.0%), French Canadian (90.9%, a difference of 0.010%), Immigrants from Latvia (90.9%, a difference of 0.010%), Immigrants from South Central Asia (90.9%, a difference of 0.030%), and Czechoslovakian (90.9%, a difference of 0.040%).
| Demographics | Rating | Rank | High School Diploma |
| Immigrants | South Africa | 99.6 /100 | #65 | Exceptional 91.0% |
| French | 99.5 /100 | #66 | Exceptional 91.0% |
| Immigrants | Iran | 99.5 /100 | #67 | Exceptional 90.9% |
| Czechoslovakians | 99.5 /100 | #68 | Exceptional 90.9% |
| French Canadians | 99.5 /100 | #69 | Exceptional 90.9% |
| Immigrants | Latvia | 99.5 /100 | #70 | Exceptional 90.9% |
| Alaskan Athabascans | 99.4 /100 | #71 | Exceptional 90.9% |
| Soviet Union | 99.4 /100 | #72 | Exceptional 90.9% |
| Immigrants | South Central Asia | 99.4 /100 | #73 | Exceptional 90.9% |
| Immigrants | Czechoslovakia | 99.4 /100 | #74 | Exceptional 90.9% |
| Cambodians | 99.4 /100 | #75 | Exceptional 90.8% |
| Hungarians | 99.3 /100 | #76 | Exceptional 90.8% |
| Native Hawaiians | 99.3 /100 | #77 | Exceptional 90.8% |
| Burmese | 99.3 /100 | #78 | Exceptional 90.8% |
| Immigrants | Denmark | 99.3 /100 | #79 | Exceptional 90.8% |