Cheyenne vs Soviet Union Per Capita Income
COMPARE
Cheyenne
Soviet Union
Per Capita Income
Per Capita Income Comparison
Cheyenne
Soviet Union
$35,276
PER CAPITA INCOME
0.0/ 100
METRIC RATING
323rd/ 347
METRIC RANK
$54,202
PER CAPITA INCOME
100.0/ 100
METRIC RATING
20th/ 347
METRIC RANK
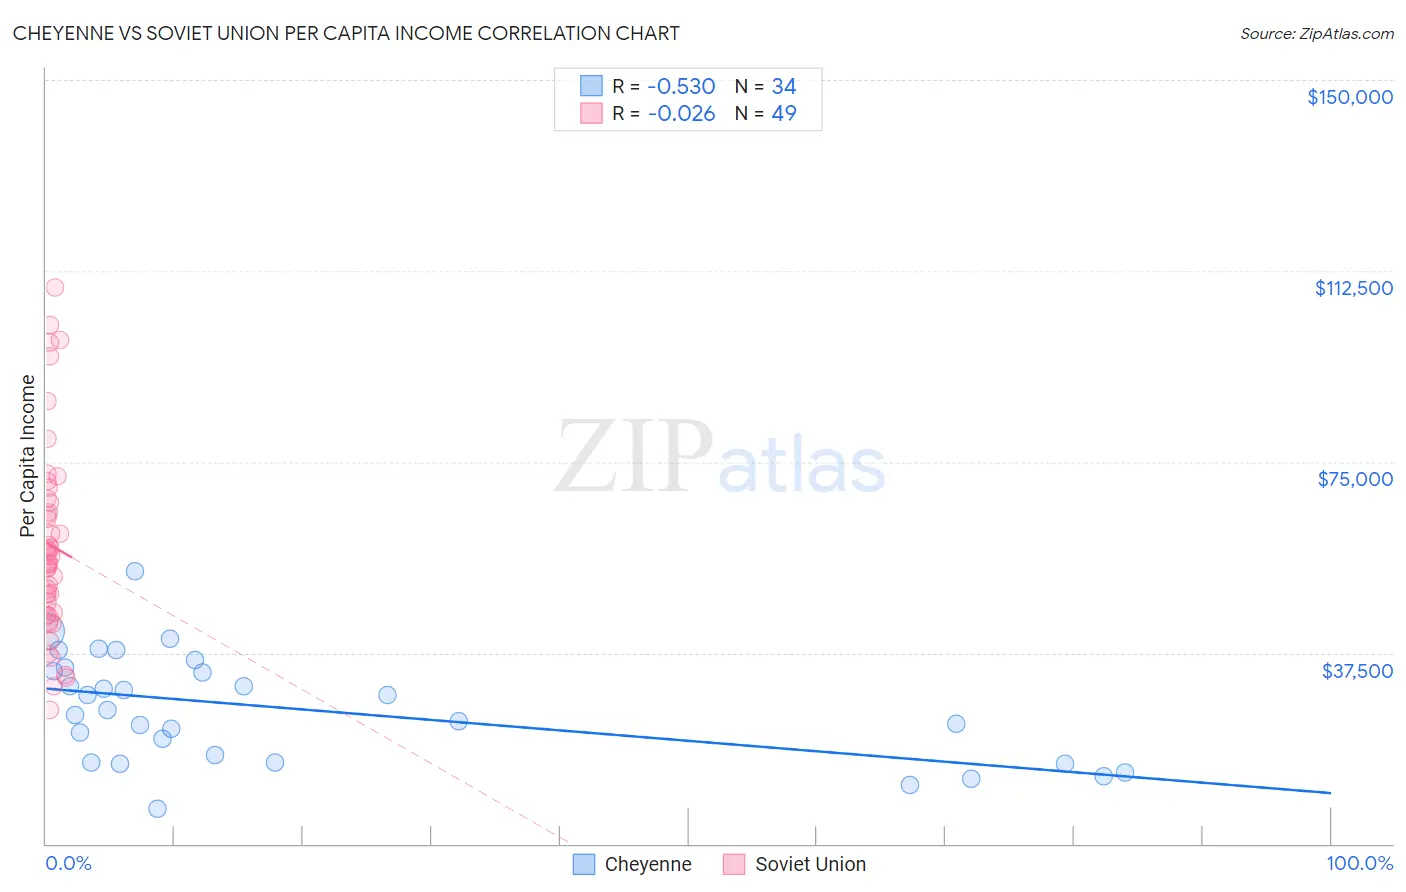
Cheyenne vs Soviet Union Per Capita Income Correlation Chart
The statistical analysis conducted on geographies consisting of 80,722,590 people shows a substantial negative correlation between the proportion of Cheyenne and per capita income in the United States with a correlation coefficient (R) of -0.530 and weighted average of $35,276. Similarly, the statistical analysis conducted on geographies consisting of 43,511,973 people shows no correlation between the proportion of Soviet Union and per capita income in the United States with a correlation coefficient (R) of -0.026 and weighted average of $54,202, a difference of 53.6%.
Per Capita Income Correlation Summary
| Measurement | Cheyenne | Soviet Union |
| Minimum | $6,772 | $26,314 |
| Maximum | $53,471 | $109,367 |
| Range | $46,699 | $83,053 |
| Mean | $26,352 | $58,669 |
| Median | $25,776 | $55,152 |
| Interquartile 25% (IQ1) | $15,918 | $45,115 |
| Interquartile 75% (IQ3) | $33,955 | $67,421 |
| Interquartile Range (IQR) | $18,037 | $22,306 |
| Standard Deviation (Sample) | $10,544 | $19,133 |
| Standard Deviation (Population) | $10,388 | $18,936 |
Similar Demographics by Per Capita Income
Demographics Similar to Cheyenne by Per Capita Income
In terms of per capita income, the demographic groups most similar to Cheyenne are Kiowa ($35,102, a difference of 0.50%), Creek ($35,546, a difference of 0.76%), Black/African American ($35,564, a difference of 0.82%), Immigrants from Central America ($34,974, a difference of 0.87%), and Immigrants from Cuba ($34,910, a difference of 1.1%).
| Demographics | Rating | Rank | Per Capita Income |
| Choctaw | 0.0 /100 | #316 | Tragic $35,999 |
| Dutch West Indians | 0.0 /100 | #317 | Tragic $35,922 |
| Bangladeshis | 0.0 /100 | #318 | Tragic $35,897 |
| Immigrants | Congo | 0.0 /100 | #319 | Tragic $35,720 |
| Hispanics or Latinos | 0.0 /100 | #320 | Tragic $35,688 |
| Blacks/African Americans | 0.0 /100 | #321 | Tragic $35,564 |
| Creek | 0.0 /100 | #322 | Tragic $35,546 |
| Cheyenne | 0.0 /100 | #323 | Tragic $35,276 |
| Kiowa | 0.0 /100 | #324 | Tragic $35,102 |
| Immigrants | Central America | 0.0 /100 | #325 | Tragic $34,974 |
| Immigrants | Cuba | 0.0 /100 | #326 | Tragic $34,910 |
| Apache | 0.0 /100 | #327 | Tragic $34,886 |
| Menominee | 0.0 /100 | #328 | Tragic $34,578 |
| Mexicans | 0.0 /100 | #329 | Tragic $34,559 |
| Spanish American Indians | 0.0 /100 | #330 | Tragic $34,195 |
Demographics Similar to Soviet Union by Per Capita Income
In terms of per capita income, the demographic groups most similar to Soviet Union are Immigrants from Northern Europe ($54,159, a difference of 0.080%), Immigrants from China ($54,264, a difference of 0.11%), Thai ($54,307, a difference of 0.19%), Indian (Asian) ($53,874, a difference of 0.61%), and Immigrants from France ($54,557, a difference of 0.65%).
| Demographics | Rating | Rank | Per Capita Income |
| Immigrants | India | 100.0 /100 | #13 | Exceptional $55,268 |
| Immigrants | Belgium | 100.0 /100 | #14 | Exceptional $55,082 |
| Cypriots | 100.0 /100 | #15 | Exceptional $54,899 |
| Immigrants | Switzerland | 100.0 /100 | #16 | Exceptional $54,866 |
| Immigrants | France | 100.0 /100 | #17 | Exceptional $54,557 |
| Thais | 100.0 /100 | #18 | Exceptional $54,307 |
| Immigrants | China | 100.0 /100 | #19 | Exceptional $54,264 |
| Soviet Union | 100.0 /100 | #20 | Exceptional $54,202 |
| Immigrants | Northern Europe | 100.0 /100 | #21 | Exceptional $54,159 |
| Indians (Asian) | 100.0 /100 | #22 | Exceptional $53,874 |
| Immigrants | Eastern Asia | 100.0 /100 | #23 | Exceptional $53,806 |
| Immigrants | Denmark | 100.0 /100 | #24 | Exceptional $53,799 |
| Immigrants | Japan | 100.0 /100 | #25 | Exceptional $53,359 |
| Russians | 100.0 /100 | #26 | Exceptional $53,154 |
| Immigrants | South Central Asia | 100.0 /100 | #27 | Exceptional $52,660 |