Ghanaian vs Soviet Union 9th Grade
COMPARE
Ghanaian
Soviet Union
9th Grade
9th Grade Comparison
Ghanaians
Soviet Union
93.9%
9TH GRADE
0.5/ 100
METRIC RATING
259th/ 347
METRIC RANK
95.4%
9TH GRADE
95.6/ 100
METRIC RATING
119th/ 347
METRIC RANK
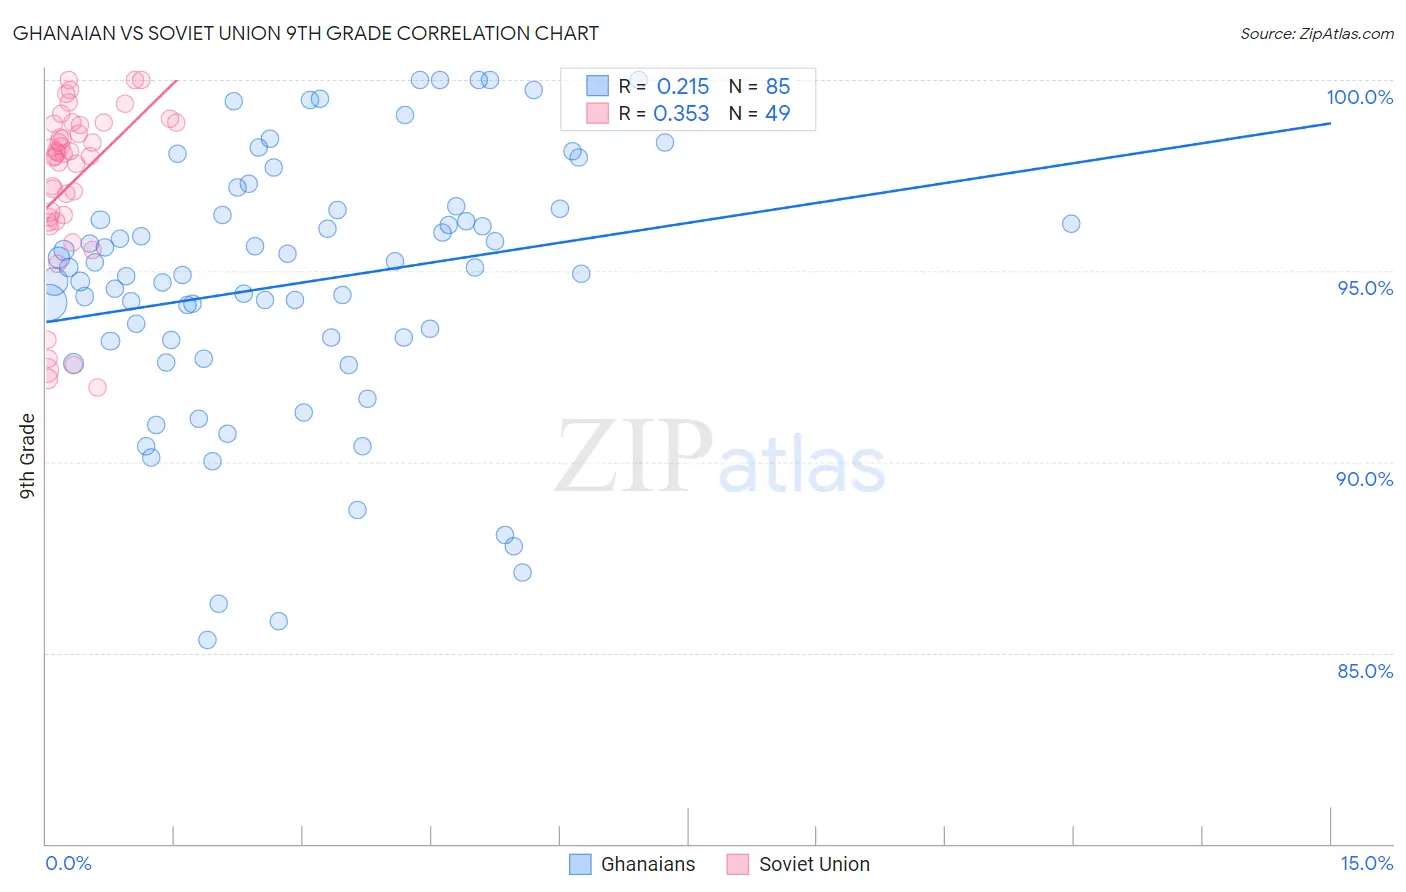
Ghanaian vs Soviet Union 9th Grade Correlation Chart
The statistical analysis conducted on geographies consisting of 190,714,671 people shows a weak positive correlation between the proportion of Ghanaians and percentage of population with at least 9th grade education in the United States with a correlation coefficient (R) of 0.215 and weighted average of 93.9%. Similarly, the statistical analysis conducted on geographies consisting of 43,454,395 people shows a mild positive correlation between the proportion of Soviet Union and percentage of population with at least 9th grade education in the United States with a correlation coefficient (R) of 0.353 and weighted average of 95.4%, a difference of 1.6%.
9th Grade Correlation Summary
| Measurement | Ghanaian | Soviet Union |
| Minimum | 85.3% | 92.0% |
| Maximum | 100.0% | 100.0% |
| Range | 14.7% | 8.0% |
| Mean | 94.7% | 97.3% |
| Median | 95.1% | 98.1% |
| Interquartile 25% (IQ1) | 93.2% | 96.3% |
| Interquartile 75% (IQ3) | 96.6% | 98.9% |
| Interquartile Range (IQR) | 3.4% | 2.5% |
| Standard Deviation (Sample) | 3.4% | 2.2% |
| Standard Deviation (Population) | 3.4% | 2.2% |
Similar Demographics by 9th Grade
Demographics Similar to Ghanaians by 9th Grade
In terms of 9th grade, the demographic groups most similar to Ghanaians are Immigrants from Thailand (93.9%, a difference of 0.0%), Immigrants from Costa Rica (94.0%, a difference of 0.010%), Pima (93.9%, a difference of 0.010%), Immigrants from Afghanistan (94.0%, a difference of 0.020%), and South American (93.9%, a difference of 0.020%).
| Demographics | Rating | Rank | 9th Grade |
| Immigrants | Senegal | 0.9 /100 | #252 | Tragic 94.1% |
| Colombians | 0.8 /100 | #253 | Tragic 94.0% |
| U.S. Virgin Islanders | 0.7 /100 | #254 | Tragic 94.0% |
| Immigrants | Nigeria | 0.6 /100 | #255 | Tragic 94.0% |
| Immigrants | Afghanistan | 0.5 /100 | #256 | Tragic 94.0% |
| Immigrants | Costa Rica | 0.5 /100 | #257 | Tragic 94.0% |
| Immigrants | Thailand | 0.5 /100 | #258 | Tragic 93.9% |
| Ghanaians | 0.5 /100 | #259 | Tragic 93.9% |
| Pima | 0.4 /100 | #260 | Tragic 93.9% |
| South Americans | 0.4 /100 | #261 | Tragic 93.9% |
| Immigrants | Jamaica | 0.4 /100 | #262 | Tragic 93.9% |
| Immigrants | Uzbekistan | 0.4 /100 | #263 | Tragic 93.9% |
| Immigrants | Congo | 0.4 /100 | #264 | Tragic 93.9% |
| Natives/Alaskans | 0.4 /100 | #265 | Tragic 93.9% |
| Navajo | 0.3 /100 | #266 | Tragic 93.9% |
Demographics Similar to Soviet Union by 9th Grade
In terms of 9th grade, the demographic groups most similar to Soviet Union are Immigrants from Europe (95.4%, a difference of 0.0%), Immigrants from Romania (95.4%, a difference of 0.0%), Immigrants from Turkey (95.4%, a difference of 0.0%), Cambodian (95.4%, a difference of 0.0%), and Cree (95.4%, a difference of 0.0%).
| Demographics | Rating | Rank | 9th Grade |
| Immigrants | Croatia | 96.2 /100 | #112 | Exceptional 95.4% |
| Iroquois | 96.2 /100 | #113 | Exceptional 95.4% |
| German Russians | 96.1 /100 | #114 | Exceptional 95.4% |
| Burmese | 96.0 /100 | #115 | Exceptional 95.4% |
| Immigrants | Europe | 95.7 /100 | #116 | Exceptional 95.4% |
| Immigrants | Romania | 95.6 /100 | #117 | Exceptional 95.4% |
| Immigrants | Turkey | 95.6 /100 | #118 | Exceptional 95.4% |
| Soviet Union | 95.6 /100 | #119 | Exceptional 95.4% |
| Cambodians | 95.6 /100 | #120 | Exceptional 95.4% |
| Cree | 95.5 /100 | #121 | Exceptional 95.4% |
| Immigrants | Kuwait | 95.5 /100 | #122 | Exceptional 95.4% |
| Kiowa | 95.3 /100 | #123 | Exceptional 95.4% |
| Shoshone | 95.3 /100 | #124 | Exceptional 95.4% |
| Immigrants | South Central Asia | 95.1 /100 | #125 | Exceptional 95.4% |
| Immigrants | Serbia | 94.4 /100 | #126 | Exceptional 95.4% |