Navajo vs Soviet Union Per Capita Income
COMPARE
Navajo
Soviet Union
Per Capita Income
Per Capita Income Comparison
Navajo
Soviet Union
$29,031
PER CAPITA INCOME
0.0/ 100
METRIC RATING
347th/ 347
METRIC RANK
$54,202
PER CAPITA INCOME
100.0/ 100
METRIC RATING
20th/ 347
METRIC RANK
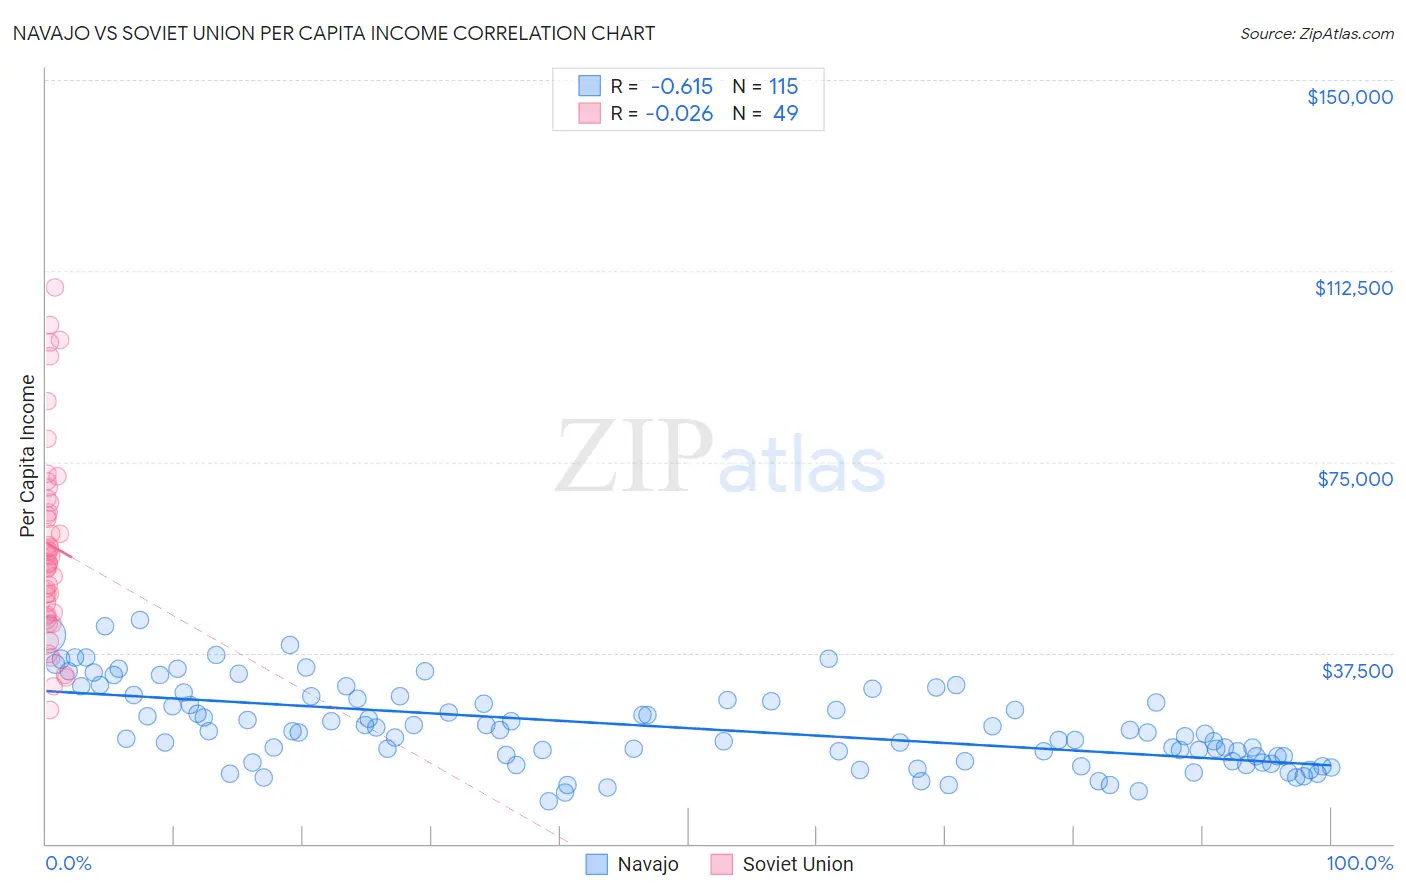
Navajo vs Soviet Union Per Capita Income Correlation Chart
The statistical analysis conducted on geographies consisting of 224,872,448 people shows a significant negative correlation between the proportion of Navajo and per capita income in the United States with a correlation coefficient (R) of -0.615 and weighted average of $29,031. Similarly, the statistical analysis conducted on geographies consisting of 43,511,973 people shows no correlation between the proportion of Soviet Union and per capita income in the United States with a correlation coefficient (R) of -0.026 and weighted average of $54,202, a difference of 86.7%.
Per Capita Income Correlation Summary
| Measurement | Navajo | Soviet Union |
| Minimum | $8,247 | $26,314 |
| Maximum | $43,851 | $109,367 |
| Range | $35,604 | $83,053 |
| Mean | $22,991 | $58,669 |
| Median | $21,965 | $55,152 |
| Interquartile 25% (IQ1) | $16,235 | $45,115 |
| Interquartile 75% (IQ3) | $28,907 | $67,421 |
| Interquartile Range (IQR) | $12,672 | $22,306 |
| Standard Deviation (Sample) | $8,079 | $19,133 |
| Standard Deviation (Population) | $8,043 | $18,936 |
Similar Demographics by Per Capita Income
Demographics Similar to Navajo by Per Capita Income
In terms of per capita income, the demographic groups most similar to Navajo are Lumbee ($29,845, a difference of 2.8%), Tohono O'odham ($30,256, a difference of 4.2%), Yup'ik ($30,518, a difference of 5.1%), Pima ($30,644, a difference of 5.6%), and Hopi ($31,177, a difference of 7.4%).
| Demographics | Rating | Rank | Per Capita Income |
| Immigrants | Yemen | 0.0 /100 | #333 | Tragic $33,696 |
| Natives/Alaskans | 0.0 /100 | #334 | Tragic $33,279 |
| Yuman | 0.0 /100 | #335 | Tragic $33,236 |
| Yakama | 0.0 /100 | #336 | Tragic $33,009 |
| Houma | 0.0 /100 | #337 | Tragic $32,996 |
| Arapaho | 0.0 /100 | #338 | Tragic $32,345 |
| Pueblo | 0.0 /100 | #339 | Tragic $32,012 |
| Crow | 0.0 /100 | #340 | Tragic $31,729 |
| Puerto Ricans | 0.0 /100 | #341 | Tragic $31,268 |
| Hopi | 0.0 /100 | #342 | Tragic $31,177 |
| Pima | 0.0 /100 | #343 | Tragic $30,644 |
| Yup'ik | 0.0 /100 | #344 | Tragic $30,518 |
| Tohono O'odham | 0.0 /100 | #345 | Tragic $30,256 |
| Lumbee | 0.0 /100 | #346 | Tragic $29,845 |
| Navajo | 0.0 /100 | #347 | Tragic $29,031 |
Demographics Similar to Soviet Union by Per Capita Income
In terms of per capita income, the demographic groups most similar to Soviet Union are Immigrants from Northern Europe ($54,159, a difference of 0.080%), Immigrants from China ($54,264, a difference of 0.11%), Thai ($54,307, a difference of 0.19%), Indian (Asian) ($53,874, a difference of 0.61%), and Immigrants from France ($54,557, a difference of 0.65%).
| Demographics | Rating | Rank | Per Capita Income |
| Immigrants | India | 100.0 /100 | #13 | Exceptional $55,268 |
| Immigrants | Belgium | 100.0 /100 | #14 | Exceptional $55,082 |
| Cypriots | 100.0 /100 | #15 | Exceptional $54,899 |
| Immigrants | Switzerland | 100.0 /100 | #16 | Exceptional $54,866 |
| Immigrants | France | 100.0 /100 | #17 | Exceptional $54,557 |
| Thais | 100.0 /100 | #18 | Exceptional $54,307 |
| Immigrants | China | 100.0 /100 | #19 | Exceptional $54,264 |
| Soviet Union | 100.0 /100 | #20 | Exceptional $54,202 |
| Immigrants | Northern Europe | 100.0 /100 | #21 | Exceptional $54,159 |
| Indians (Asian) | 100.0 /100 | #22 | Exceptional $53,874 |
| Immigrants | Eastern Asia | 100.0 /100 | #23 | Exceptional $53,806 |
| Immigrants | Denmark | 100.0 /100 | #24 | Exceptional $53,799 |
| Immigrants | Japan | 100.0 /100 | #25 | Exceptional $53,359 |
| Russians | 100.0 /100 | #26 | Exceptional $53,154 |
| Immigrants | South Central Asia | 100.0 /100 | #27 | Exceptional $52,660 |