Bahamian vs Soviet Union Per Capita Income
COMPARE
Bahamian
Soviet Union
Per Capita Income
Per Capita Income Comparison
Bahamians
Soviet Union
$36,427
PER CAPITA INCOME
0.0/ 100
METRIC RATING
313th/ 347
METRIC RANK
$54,202
PER CAPITA INCOME
100.0/ 100
METRIC RATING
20th/ 347
METRIC RANK
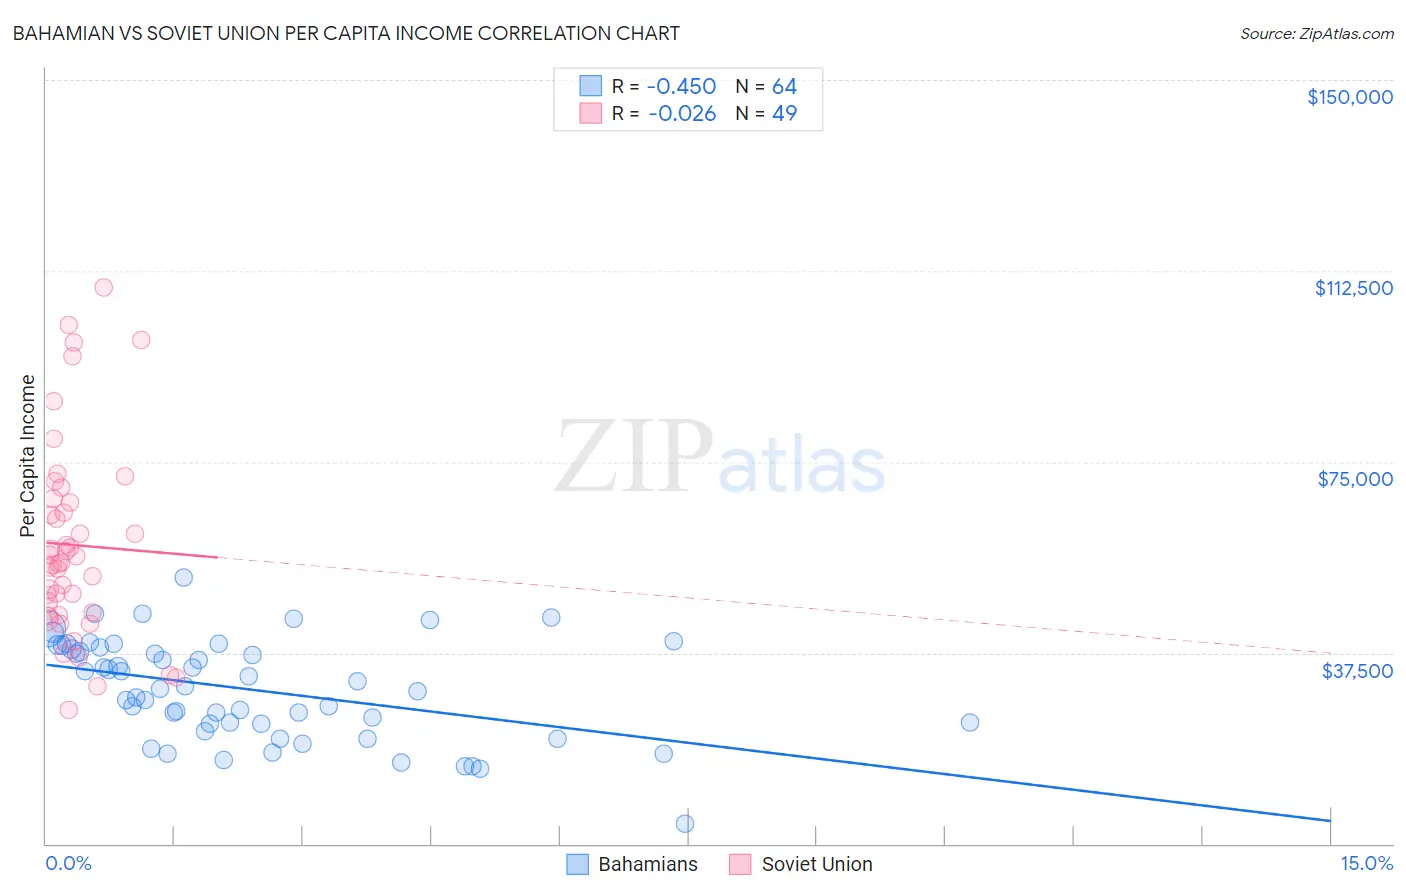
Bahamian vs Soviet Union Per Capita Income Correlation Chart
The statistical analysis conducted on geographies consisting of 112,707,980 people shows a moderate negative correlation between the proportion of Bahamians and per capita income in the United States with a correlation coefficient (R) of -0.450 and weighted average of $36,427. Similarly, the statistical analysis conducted on geographies consisting of 43,511,973 people shows no correlation between the proportion of Soviet Union and per capita income in the United States with a correlation coefficient (R) of -0.026 and weighted average of $54,202, a difference of 48.8%.
Per Capita Income Correlation Summary
| Measurement | Bahamian | Soviet Union |
| Minimum | $3,864 | $26,314 |
| Maximum | $52,210 | $109,367 |
| Range | $48,346 | $83,053 |
| Mean | $30,310 | $58,669 |
| Median | $30,639 | $55,152 |
| Interquartile 25% (IQ1) | $23,571 | $45,115 |
| Interquartile 75% (IQ3) | $38,367 | $67,421 |
| Interquartile Range (IQR) | $14,797 | $22,306 |
| Standard Deviation (Sample) | $9,801 | $19,133 |
| Standard Deviation (Population) | $9,724 | $18,936 |
Similar Demographics by Per Capita Income
Demographics Similar to Bahamians by Per Capita Income
In terms of per capita income, the demographic groups most similar to Bahamians are Chickasaw ($36,475, a difference of 0.13%), Chippewa ($36,631, a difference of 0.56%), Ute ($36,651, a difference of 0.62%), Immigrants from Honduras ($36,665, a difference of 0.65%), and Seminole ($36,180, a difference of 0.68%).
| Demographics | Rating | Rank | Per Capita Income |
| Immigrants | Haiti | 0.0 /100 | #306 | Tragic $36,849 |
| Immigrants | Latin America | 0.0 /100 | #307 | Tragic $36,823 |
| Fijians | 0.0 /100 | #308 | Tragic $36,690 |
| Immigrants | Honduras | 0.0 /100 | #309 | Tragic $36,665 |
| Ute | 0.0 /100 | #310 | Tragic $36,651 |
| Chippewa | 0.0 /100 | #311 | Tragic $36,631 |
| Chickasaw | 0.0 /100 | #312 | Tragic $36,475 |
| Bahamians | 0.0 /100 | #313 | Tragic $36,427 |
| Seminole | 0.0 /100 | #314 | Tragic $36,180 |
| Yaqui | 0.0 /100 | #315 | Tragic $36,112 |
| Choctaw | 0.0 /100 | #316 | Tragic $35,999 |
| Dutch West Indians | 0.0 /100 | #317 | Tragic $35,922 |
| Bangladeshis | 0.0 /100 | #318 | Tragic $35,897 |
| Immigrants | Congo | 0.0 /100 | #319 | Tragic $35,720 |
| Hispanics or Latinos | 0.0 /100 | #320 | Tragic $35,688 |
Demographics Similar to Soviet Union by Per Capita Income
In terms of per capita income, the demographic groups most similar to Soviet Union are Immigrants from Northern Europe ($54,159, a difference of 0.080%), Immigrants from China ($54,264, a difference of 0.11%), Thai ($54,307, a difference of 0.19%), Indian (Asian) ($53,874, a difference of 0.61%), and Immigrants from France ($54,557, a difference of 0.65%).
| Demographics | Rating | Rank | Per Capita Income |
| Immigrants | India | 100.0 /100 | #13 | Exceptional $55,268 |
| Immigrants | Belgium | 100.0 /100 | #14 | Exceptional $55,082 |
| Cypriots | 100.0 /100 | #15 | Exceptional $54,899 |
| Immigrants | Switzerland | 100.0 /100 | #16 | Exceptional $54,866 |
| Immigrants | France | 100.0 /100 | #17 | Exceptional $54,557 |
| Thais | 100.0 /100 | #18 | Exceptional $54,307 |
| Immigrants | China | 100.0 /100 | #19 | Exceptional $54,264 |
| Soviet Union | 100.0 /100 | #20 | Exceptional $54,202 |
| Immigrants | Northern Europe | 100.0 /100 | #21 | Exceptional $54,159 |
| Indians (Asian) | 100.0 /100 | #22 | Exceptional $53,874 |
| Immigrants | Eastern Asia | 100.0 /100 | #23 | Exceptional $53,806 |
| Immigrants | Denmark | 100.0 /100 | #24 | Exceptional $53,799 |
| Immigrants | Japan | 100.0 /100 | #25 | Exceptional $53,359 |
| Russians | 100.0 /100 | #26 | Exceptional $53,154 |
| Immigrants | South Central Asia | 100.0 /100 | #27 | Exceptional $52,660 |