Ghanaian vs Canadian Per Capita Income
COMPARE
Ghanaian
Canadian
Per Capita Income
Per Capita Income Comparison
Ghanaians
Canadians
$42,164
PER CAPITA INCOME
15.7/ 100
METRIC RATING
206th/ 347
METRIC RANK
$45,858
PER CAPITA INCOME
92.2/ 100
METRIC RATING
121st/ 347
METRIC RANK
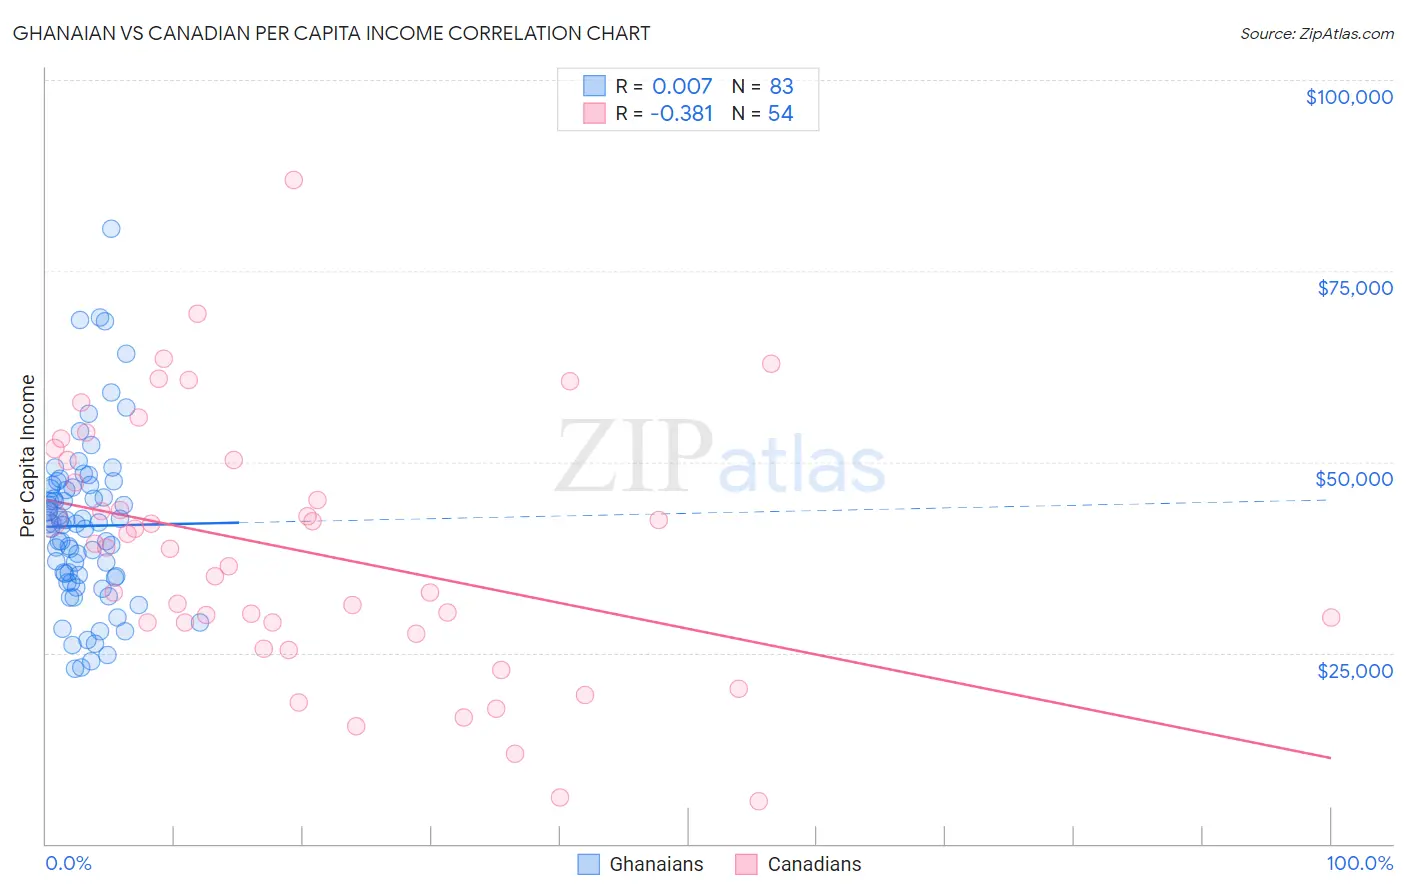
Ghanaian vs Canadian Per Capita Income Correlation Chart
The statistical analysis conducted on geographies consisting of 190,723,780 people shows no correlation between the proportion of Ghanaians and per capita income in the United States with a correlation coefficient (R) of 0.007 and weighted average of $42,164. Similarly, the statistical analysis conducted on geographies consisting of 437,574,482 people shows a mild negative correlation between the proportion of Canadians and per capita income in the United States with a correlation coefficient (R) of -0.381 and weighted average of $45,858, a difference of 8.8%.
Per Capita Income Correlation Summary
| Measurement | Ghanaian | Canadian |
| Minimum | $22,951 | $5,500 |
| Maximum | $80,537 | $86,868 |
| Range | $57,586 | $81,368 |
| Mean | $41,613 | $38,269 |
| Median | $41,877 | $38,676 |
| Interquartile 25% (IQ1) | $34,906 | $28,934 |
| Interquartile 75% (IQ3) | $46,657 | $50,164 |
| Interquartile Range (IQR) | $11,751 | $21,231 |
| Standard Deviation (Sample) | $10,874 | $16,643 |
| Standard Deviation (Population) | $10,809 | $16,488 |
Similar Demographics by Per Capita Income
Demographics Similar to Ghanaians by Per Capita Income
In terms of per capita income, the demographic groups most similar to Ghanaians are White/Caucasian ($42,180, a difference of 0.040%), Aleut ($42,210, a difference of 0.11%), Spanish ($42,249, a difference of 0.20%), Venezuelan ($42,074, a difference of 0.21%), and Immigrants from Bosnia and Herzegovina ($42,278, a difference of 0.27%).
| Demographics | Rating | Rank | Per Capita Income |
| Barbadians | 19.6 /100 | #199 | Poor $42,406 |
| Vietnamese | 19.0 /100 | #200 | Poor $42,368 |
| Immigrants | Thailand | 17.6 /100 | #201 | Poor $42,289 |
| Immigrants | Bosnia and Herzegovina | 17.5 /100 | #202 | Poor $42,278 |
| Spanish | 17.0 /100 | #203 | Poor $42,249 |
| Aleuts | 16.4 /100 | #204 | Poor $42,210 |
| Whites/Caucasians | 15.9 /100 | #205 | Poor $42,180 |
| Ghanaians | 15.7 /100 | #206 | Poor $42,164 |
| Venezuelans | 14.4 /100 | #207 | Poor $42,074 |
| Panamanians | 13.9 /100 | #208 | Poor $42,035 |
| Immigrants | Sudan | 13.2 /100 | #209 | Poor $41,986 |
| Ecuadorians | 12.9 /100 | #210 | Poor $41,958 |
| Immigrants | Panama | 11.6 /100 | #211 | Poor $41,853 |
| Immigrants | Senegal | 11.3 /100 | #212 | Poor $41,830 |
| Immigrants | Venezuela | 10.2 /100 | #213 | Poor $41,727 |
Demographics Similar to Canadians by Per Capita Income
In terms of per capita income, the demographic groups most similar to Canadians are Moroccan ($45,854, a difference of 0.010%), Lebanese ($45,840, a difference of 0.040%), European ($45,836, a difference of 0.050%), Zimbabwean ($45,804, a difference of 0.12%), and Immigrants from Ethiopia ($45,923, a difference of 0.14%).
| Demographics | Rating | Rank | Per Capita Income |
| Afghans | 94.9 /100 | #114 | Exceptional $46,268 |
| Immigrants | Chile | 94.6 /100 | #115 | Exceptional $46,213 |
| Poles | 94.1 /100 | #116 | Exceptional $46,123 |
| Chinese | 93.9 /100 | #117 | Exceptional $46,098 |
| Immigrants | Saudi Arabia | 93.3 /100 | #118 | Exceptional $46,008 |
| Immigrants | Poland | 93.1 /100 | #119 | Exceptional $45,979 |
| Immigrants | Ethiopia | 92.7 /100 | #120 | Exceptional $45,923 |
| Canadians | 92.2 /100 | #121 | Exceptional $45,858 |
| Moroccans | 92.1 /100 | #122 | Exceptional $45,854 |
| Lebanese | 92.0 /100 | #123 | Exceptional $45,840 |
| Europeans | 92.0 /100 | #124 | Exceptional $45,836 |
| Zimbabweans | 91.7 /100 | #125 | Exceptional $45,804 |
| Palestinians | 91.6 /100 | #126 | Exceptional $45,790 |
| Immigrants | Germany | 91.3 /100 | #127 | Exceptional $45,751 |
| Swedes | 91.3 /100 | #128 | Exceptional $45,750 |